Feature
How much traffic are ChatGPT and Perplexity actually sending you?
Google Analytics will not tell you. It has no AI channel, and assistant visits scatter across referral and direct traffic. Flowra reads the one field that does carry the answer and shows twelve assistants as a single number, with a share and a direction.
The short answer
Google Analytics 4 has no channel group for AI assistants, so a visit from ChatGPT is filed as a referral, and a visit from an assistant that hides its referrer is filed as direct. Flowra reads the session source that GA4 already stores and groups twelve assistants into one figure: total sessions, what share of your traffic that is, and whether it grew or shrank against the previous period. It needs no new tracking code, because the data is already in your Google Analytics.
The problem
Your AI traffic is real, and it is scattered across four places
Ask most analytics tools how many people arrived from an AI assistant last month and there is no answer to give, because nothing groups them. Google Analytics organises traffic into Organic Search, Direct, Referral, Paid and Social. There is no AI. So the visits go wherever the plumbing puts them.
A person who clicks your link inside ChatGPT usually arrives as a referral from chatgpt.com. Someone arriving from Perplexity shows as a referral from perplexity.ai. Both sit in a long Source list, below a dozen bigger rows, easy to miss entirely.
Worse, one assistant rarely appears once. Google Analytics reports traffic by source and medium, so a single assistant routinely arrives as two or three separate rows. Read that list and you see three small unfamiliar sources rather than one channel that is quietly growing.
The result is that a channel worth paying attention to looks like noise. Not because the traffic is small, but because nobody added it up.
What you see
One number, a share, and a direction
Flowra adds a single card to your analytics. At the top is the total number of sessions that came from an AI assistant in the period you are looking at.
Next to it sits the share of your total traffic, and that pairing is deliberate. On its own, 142 sessions tells you nothing. 142 out of 4,100 is a rounding error you can ignore for another year. 142 out of 900 is a channel you should be building for. The count alone leads people to the wrong conclusion in both directions, so it is never shown alone.
Then the direction, against the previous period of the same length, because what matters most about this channel today is not its size but its slope.
Below that, one row per assistant, largest first, each with its own change. That is where you find out that your growth is all ChatGPT, or that Perplexity quietly tripled while you were not looking.
AI assistants
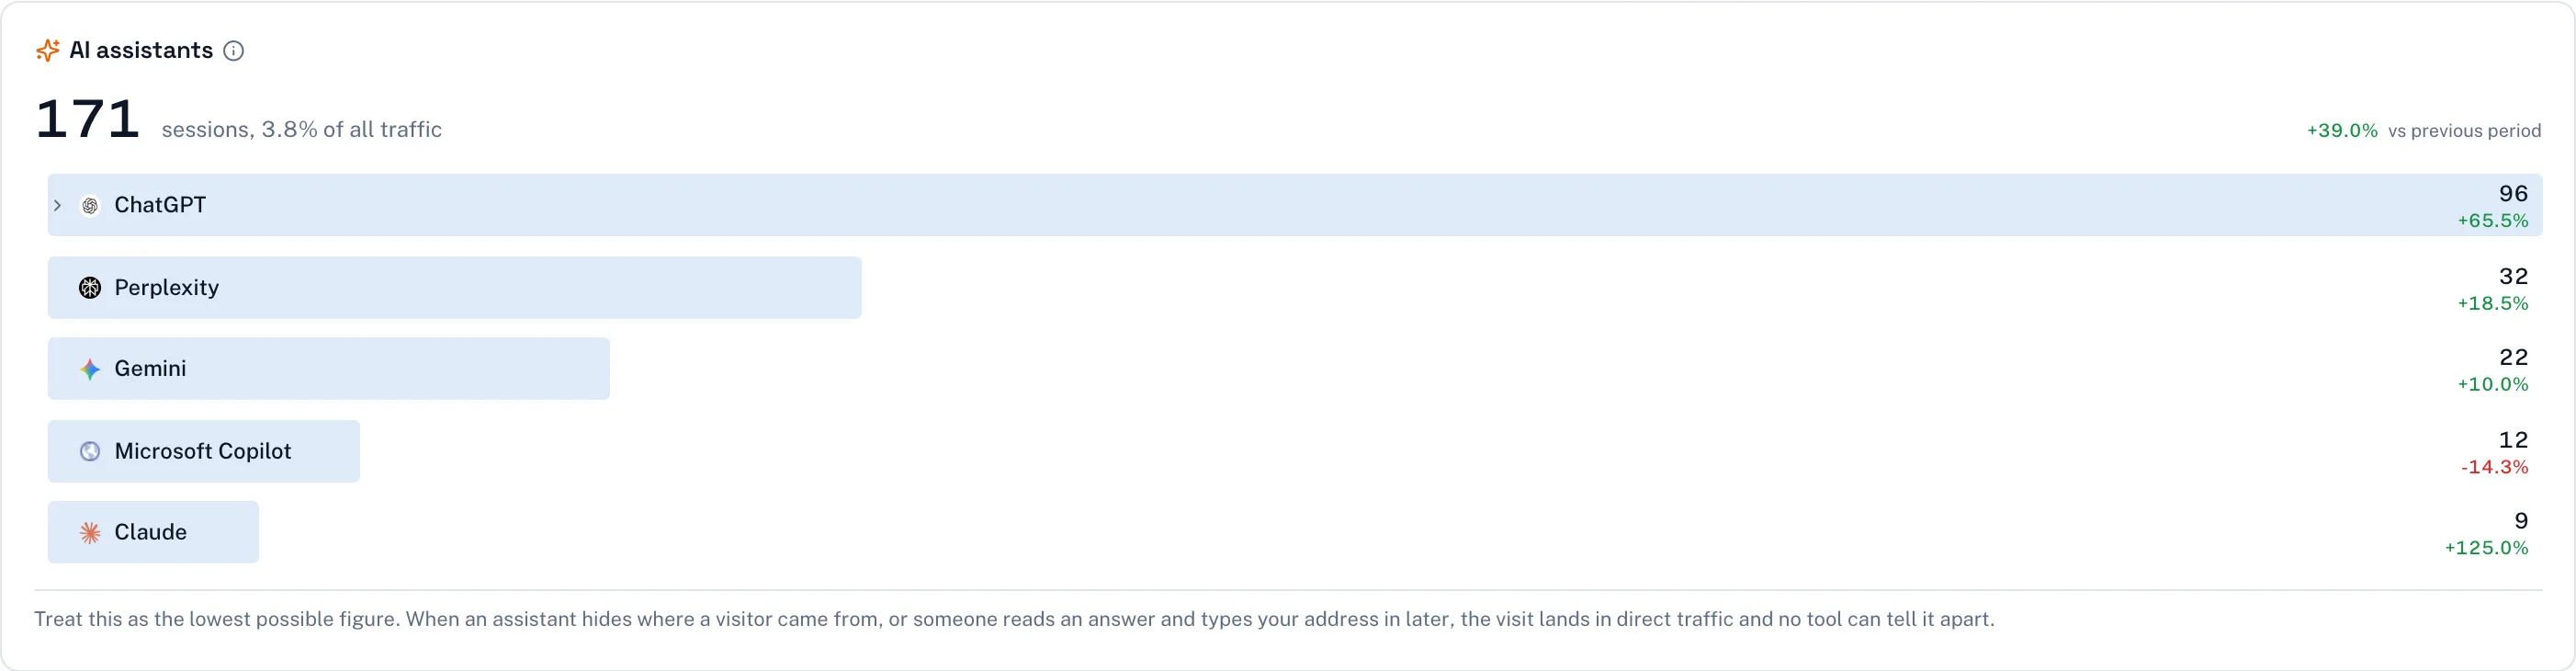
Treat this as the lowest possible figure. When an assistant hides where a visitor came from, or someone reads an answer and types your address in later, the visit lands in direct traffic and no tool can tell it apart.
In the product
What it looks like in the product
A hundred and seventy-one sessions is not a headline. Three point eight percent of all traffic, up thirty-nine percent on the month before, with Claude more than doubling off a tiny base, is a channel worth watching. That is the whole argument for showing the share and the direction next to the count rather than the count on its own.
How it decides
What counts as AI traffic, and what we refuse to count
This is the part most tools will not show you, and it is the part that decides whether the number is worth trusting. A traffic figure that flatters you is worse than no figure at all, because you will act on it.
Two rules decide what goes in the list.
Rule one: the source has to mean an assistant answered a question
Google Analytics records the hostname, and nothing else. So copilot.microsoft.com qualifies, because nobody lands there by accident. Plain bing.com does not, even though Copilot answers appear inside Bing, because counting it would sweep all your ordinary Bing search traffic into the AI number and inflate it many times over. The same reasoning keeps google.com out while gemini.google.com is in.
Rule two: a campaign tag only counts when the word means one thing
Some teams tag their own AI links, so a bare tag like chatgpt or perplexity is safe to count. meta is not, and is deliberately left out, because a Meta Ads campaign tagged utm_source=meta would otherwise be reported to your client as traffic from Meta AI. Claude, Gemini and Grok are left out for the same reason. They are also people's names.
Counted
- chatgpt.com, openai.comChatGPT
- perplexity.aiPerplexity
- gemini.google.comGemini, which is not google.com
- copilot.microsoft.comCopilot, which is not bing.com
- claude.aiClaude
Deliberately not counted
- google.comOrdinary search. An AI Overview appears here, but so does every other Google visit.
- bing.comOrdinary search, even though Copilot answers live inside Bing.
- utm_source=metaA Meta Ads campaign, far more often than Meta AI.
- utm_source=claudeAlso a person's name. Same for gemini and grok.
Two smaller decisions matter as well. Each assistant is folded into one row rather than the several rows Google Analytics splits it into, so one real assistant reads as one real assistant. And the list includes anything that sent traffic in either period, so an assistant that sent forty sessions last month and none this month still appears. That row is often the most important one on the card, and building the list from the current period alone would quietly drop it.
The honest limit
This is a floor, never a ceiling
Some AI traffic cannot be seen by anyone. When an assistant strips the referrer, the visit arrives with no clue where it came from. When someone reads an answer, closes the tab, and types your address in an hour later, that visit is direct. Both are invisible to every analytics tool on the market, this one included.
So the real number is always higher than the one on the card. We print that warning on the card itself rather than burying it in a tooltip, because this figure ends up in front of clients and in board decks, and a number that quietly overstates its own certainty is how people get embarrassed.
What the figure is genuinely good for is direction and comparison. Is this channel growing? Which assistant is driving it? Did the page we restructured last month start getting cited? Those questions are answerable from a consistent floor, even when the absolute total is understated.
Coverage
Twelve assistants, tracked separately
Each is reported on its own line, so you can see which assistants have found you and which have not. For most sites today several of these will sit at zero. That is normal, and the card says so rather than showing you an empty panel. The point of watching now is to catch the moment one of them starts moving.
Setup
No tracking code, no tags
- 1Connect Google Search ConsoleOne Google sign-in, about two minutes. No DNS changes and no developer.
- 2Connect Google AnalyticsThe same sign-in flow. This is the connection the AI figure reads from.
- 3Open Analytics, then the GA4 tabThe AI assistants card is there, already filled in with your history. Nothing to configure, because it reads data Google Analytics has been collecting all along.
Because it is derived from data you already have, the card is not blank on day one. It shows your history from the moment you connect, so you can see whether this channel has been growing for months without you noticing.
Do it yourself
How to check this in Google Analytics by hand
You do not need Flowra to get at this. The data is yours and it is already in your account. It is just laborious, so here is the manual route, both because it is genuinely useful and because you should be able to check our number against your own.
- 1In Google Analytics, open Reports, then Acquisition, then Traffic acquisition.
- 2Change the table's first column from the default to Session source.
- 3Use the search box above the table to look up one assistant at a time: chatgpt.com, then perplexity.ai, then gemini.google.com, and so on.
- 4Write down the sessions for each. Remember an assistant may appear on more than one line, so add those lines together.
- 5Change the date range to the previous period of the same length and repeat the whole thing, so you have something to compare against.
That is roughly twenty lookups and a spreadsheet, every time you want an up to date figure. Google moves this interface around from time to time, so the exact menu names may drift, but Session source is the dimension you are after wherever it ends up.
What Flowra does is that same job, on every date range you look at, with the rows already folded together and the previous period already compared. The value is not secret data. It is not having to do this again.
What to do with it
A number is only useful if it changes something
If the share is under one percent and flat, this is not your problem yet. Note it, check again next quarter, and spend your time on the pages that are losing ordinary search clicks.
If it is small but climbing every month, that is the signal to start writing for it. Assistants quote pages that answer a question plainly, near the top, in a structure a machine can lift. Flowra's AI Answer Readiness checklist walks through the structural signals that make a page quotable, which is the practical work behind a rising number here.
If one assistant dominates, that tells you where your audience actually is, and it is often not the one you would guess. A B2B audience showing heavy ChatGPT traffic and almost no Perplexity is a different situation from the reverse.
If it is falling, check whether the pages that were being cited have changed recently. An assistant that stops quoting you rarely announces it, and a restructure that helped human readers can remove the exact passage that was being lifted.
And if you report to clients, this is a line worth putting in front of them before they ask. Most agencies still have no answer to "are we showing up in ChatGPT", and showing a real figure with an honest caveat attached lands better than an opinion.
Frequently Asked Questions
Traffic from AI assistants
Related
- Every Flowra feature, including the content decay map and the rework queue.
- How the product works end to end, from finding a decaying page to publishing the fix.
- Pricing, including which plans include the full analytics dashboard.
Find out what the assistants are already sending you
Connect Google Analytics and see your history straight away. Free to start, no card needed.
Start free