Flowra

    Free tool

    Search Console report generator: a branded PDF from your export

    Export the Performance report from Google Search Console, add the zip here, and get a client-ready report with your logo and colour, saved as a PDF. The file never leaves your browser.

    Your export

    Search Console, Performance, Search results, Export, Download CSV.

    Showing a demo export for example.com until you add yours.

    Demo report

    4,717 clicks, up 21.5% on the previous period

    8 Sept 2026 to 5 Oct 2026. Check the preview, then save it as a PDF.

    Search performance report

    example.com

    8 Sept 2026 to 5 Oct 2026 · Google Search, web results

    Clicks

    4,717

    +21.5%vs previous period

    Impressions

    136,985

    +10.1%vs previous period

    Average CTR

    3.44%

    +0.3 pts

    Average position

    13.9

    0.6 betterfrom 14.5

    Summary

    Clicks from Google rose 21.5% to 4,717 compared with the previous period (3,882). Impressions were up 10.1%, and the average position moved from 14.5 to 13.9. The search that brought the most visits was "cold brew ratio", with 412 clicks. The biggest gain was /guides/pour-over-vs-french-press, up 96 clicks. The page that lost the most was /guides/descale-coffee-machine, down 58 clicks, so it is the one to look at next.

    Clicks per day

    Last 28 daysPrevious period
    184
    2026-09-082026-10-05

    Top searches

    QueryClicksChangeImpressionsCTRPosition
    cold brew ratio412+616,8806.0%2.4
    how to descale a coffee machine305-179,1203.3%4.1
    pour over vs french press228+645,4104.2%3.6
    best grind size for espresso196+557,7302.5%6.8
    example coffee174+641042.4%1.0
    how much caffeine in cold brew133+134,9602.7%7.4
    aeropress recipe98+263,8902.5%8.9
    decaf coffee process61-52,8702.1%9.6

    Top pages

    PageClicksChangeImpressionsCTRPosition
    /guides/cold-brew-ratio655+9313,1005.0%3.1
    /guides/descale-coffee-machine362-5810,8403.3%4.4
    /guides/pour-over-vs-french-press301+967,1204.2%4.0
    /guides/espresso-grind-size248+689,4502.6%7.1
    /211+71,29016.4%2.2
    /recipes/aeropress129+344,9202.6%9.2
    /guides/decaf-process77-73,3202.3%9.8

    Devices

    DeviceClicksChangeImpressions
    Mobile2,925+51893,150
    Desktop1,722+30541,780
    Tablet71+132,055

    Top countries

    CountryClicksChangeImpressions
    United States2,210+33076,400
    United Kingdom640+5021,700
    Canada412+4414,350
    Australia266+159,010
    Source: Google Search Console, Performance report export. Totals are the site totals Search Console shows above its chart. Tables list the top rows by clicks; Google leaves rare queries out of its tables, so they add up to less than the total.

    Download PDF opens your browser's print window: choose Save as PDF as the printer. On a phone it is under Share, then Print. The report shows exactly what the export holds, so if a number looks wrong, check the date range and filters you exported with.

    How to export Search Console data for the report

    1. In Search Console, pick the property, then open Performance, then Search results.
    2. Click the Date filter. For a monthly client report, choose the Compare tab and pick last 28 days against the previous period, or a custom range for last calendar month against the month before. Comparing is what gives the report its change figures.
    3. Leave Search type on Web unless the client cares about Image or News results. Any query, page or country filter you add narrows the whole export, which is useful for a report on one section of a site.
    4. Click Export at the top right and choose Download CSV. Not Excel or Google Sheets: the CSV zip is the one this tool reads.
    5. Add that zip above, as it is. There is no need to unzip it.

    The zip holds one CSV per tab of the report: Queries, Pages, Countries, Devices, Search appearance and Dates, plus Filters, which records the settings you exported with. The generator reads all of them except Search appearance.

    What the report shows, and how to read it

    • Clicks and impressions are the site totals, with the change against the previous period when you exported a comparison. Clicks are visits from Google; impressions are how often the site appeared in results at all. Impressions up and clicks flat usually means new rankings low on the page, not a problem.
    • Average CTR is clicks divided by impressions, shown as a change in percentage points. It falls naturally when a site starts appearing for more searches further down.
    • Average position is weighted by impressions, the way Search Console works it out. Lower is better, so the report calls a fall from 14.6 to 14.0 "0.6 better".
    • Clicks per day puts the two periods on top of each other. Weekends dipping is normal; a step down that stays down is the thing to explain.
    • Top searches and top pages are sorted by clicks, with the change in clicks for each. The summary draft names the page that gained most and the one that lost most, because that is the first question a client asks.

    The summary is a draft built from the numbers. It cannot know why a page moved or what you shipped this month. Write that part yourself: a report that says what changed, why, and what you will do next is worth more to a client than any chart.

    Why the numbers can differ from the Search Console screen

    Three reasons, and none of them is an error in the export.

    • Totals against tables. Google's Performance report help page says the chart totals can differ from the table totals because they are counted differently (by property and by page). The report's headline numbers come from the Dates table, so they match the chart.
    • Hidden queries. Rare queries are left out of the Queries table to protect searchers' privacy, but their clicks still count in the totals. Top searches will always add up to less than total clicks.
    • Row limit. The export from the Search Console screen stops at 1,000 rows per table. For a large site, the long tail of pages and queries is not in the file.

    How to make the same report by hand

    Open the zip and import Dates.csv, Queries.csv and Pages.csv into a spreadsheet. Sum the Clicks and Impressions columns of Dates for the totals, divide one by the other for CTR, and for average position multiply each day's position by its impressions, add those up and divide by total impressions. Sort the other two tables by clicks and keep the top ten. Paste it all under your letterhead, add a line chart of Dates, write the summary and export a PDF.

    For a report you rebuild every month, Looker Studio has a Search Console connector that pulls the same data live into a template. Building and styling the template is work, but once it exists it saves the export step each month.
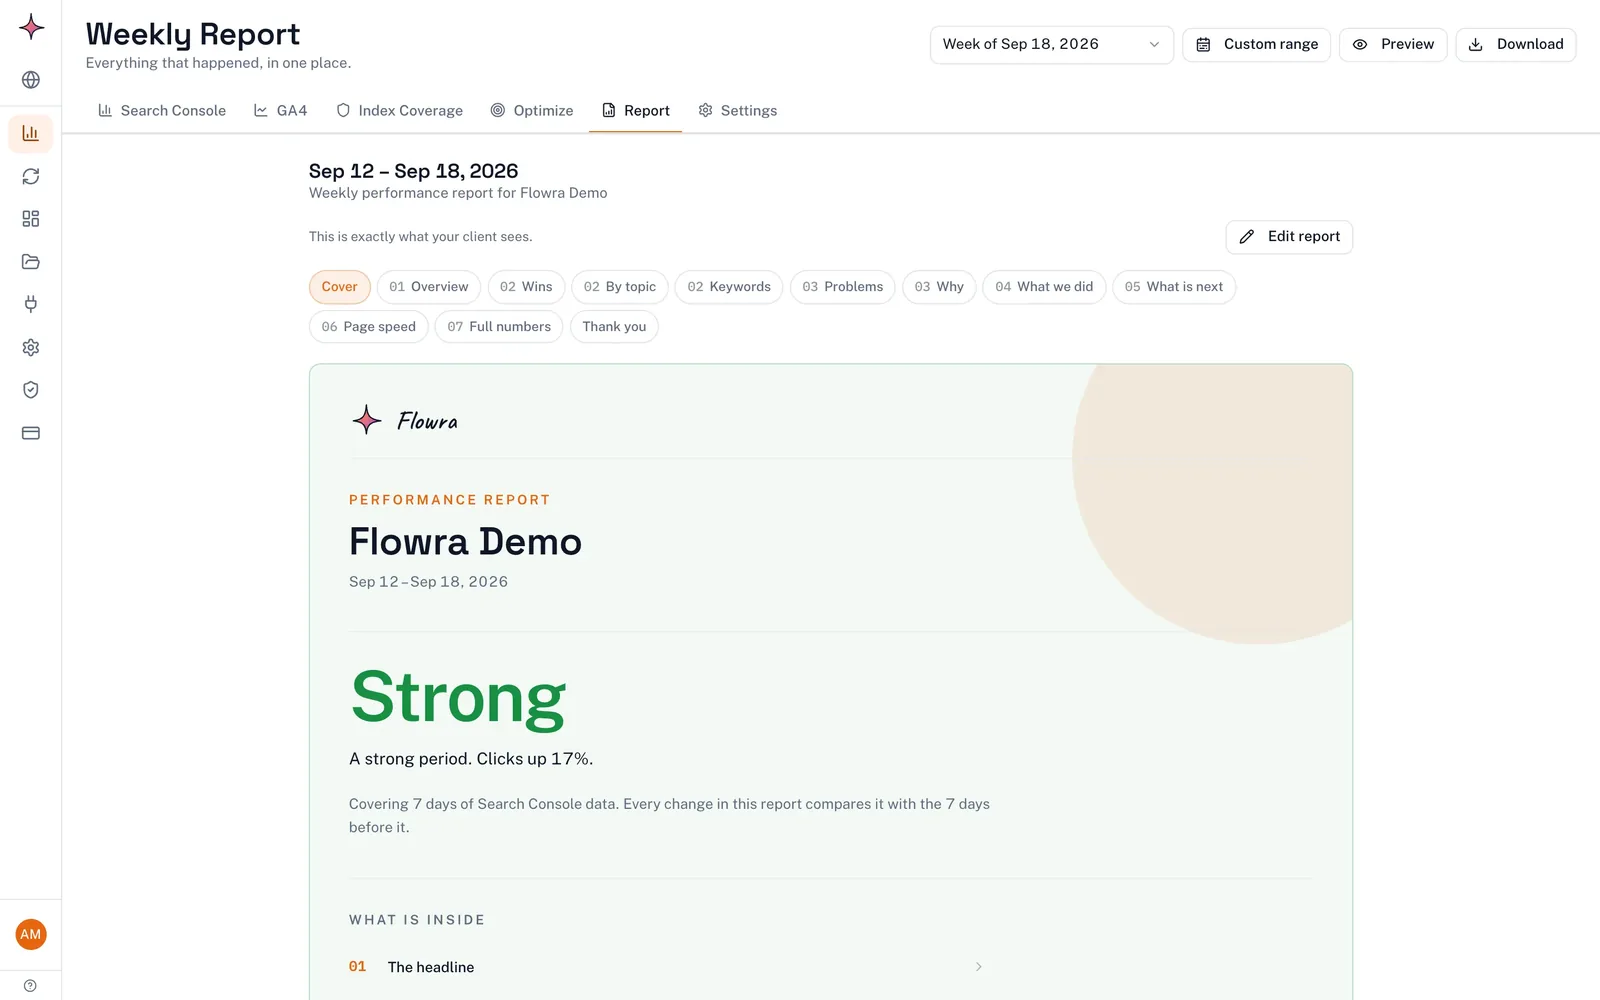
    A report that rebuilds itself every week

    An export is a snapshot: next month you download it again, and the client's copy is out of date the day it lands. Flowra connects to Search Console and keeps a report per site that rebuilds itself every week, and the app shows you when it is ready. You share it with the client as a link that always shows the current report, with your agency's name, logo and colour.

    Branded report links come with the Starter plan and above. On Starter and Pro a small "Report made with Flowra" line stays at the bottom; the Agency plan removes it.

    Flowra's weekly SEO report for a client site: a branded cover with the week's verdict, clicks up 17%, and sections for wins, keywords, problems and what is next.
    The weekly client report in Flowra. Example data, not a real site's.

    Frequently Asked Questions