To do a content audit, list every page on your site and add its Search Console and GA4 numbers. Find the pages that are losing traffic, work out why each one dropped, then decide whether to keep, update, merge or delete it. You need a crawler or your sitemap, Search Console, GA4 and a spreadsheet. A backlink tool helps but is optional.
The steps are simple. The judgement calls are where audits go wrong, so this guide spends most of its time on them: which date ranges to compare so seasonality does not fool you, how to tell a lost ranking from lost demand, and the order in which to apply the decision rules. A copyable template sits near the end.
The seven steps:
- Set a goal and a scope.
- Build an inventory of every page.
- Pull traffic, engagement, ranking and link data for each page.
- Choose a comparison window that survives seasonality.
- Find the pages losing traffic in Search Console.
- Diagnose why each one dropped.
- Keep, update, merge or delete.
What is a content audit, and why do one?
A content audit is a page-by-page review of what you have published. You measure each page against a goal and finish with a decision for every page. The inventory and the numbers are only the means to that. If your audit ends in a spreadsheet with no actions in it, you have made an inventory, not an audit.
Most published pages get no search traffic at all. When Ahrefs looked at the roughly 14 billion pages in its index for a 2023 study, 96.55% of them got no traffic from Google, and another 1.94% got 1 to 10 visits a month. Your site will not look that extreme. It will still have a long tail of pages doing nothing, plus a smaller set of pages that used to do well and are now sliding.
An audit pays off in three ways:
- You recover lost traffic. A page that used to rank already has links, history and a topic Google associates with it. Fixing it is often cheaper than getting a brand new page to the same position.
- You remove overlap. Two pages aimed at the same search split the clicks and the links. Merging them gives one page a better chance.
- You learn what to write next. Your winners and your gaps show which topics deserve more pages.
Quantitative vs qualitative content audits
A quantitative audit looks at numbers: clicks, impressions, position, engagement and links. It covers every page and tells you where to look. A qualitative audit is a person reading the page and asking questions. Is it accurate? Does it answer the search? Is it better than what ranks now? That takes time, so you save it for the pages the numbers flag.
| Quantitative | Qualitative | |
|---|---|---|
| Question it answers | Which pages are winning, losing or doing nothing? | Why, and what would fix it? |
| Covers | Every page | Only the pages the numbers flag |
| Data | Search Console, GA4, crawler, backlink tool | The page, the current search results, your own knowledge |
| Output | A sorted list with flags | A decision and a short brief per page |
| Time per page | Seconds, once exports are joined | Minutes |
Do both, in that order. The numbers shrink the list and the reading makes the call. If you start by reading every page, the audit tends to stall somewhere around page 40.
Step 1: Set a goal and a scope
Pick one main goal. The goal decides which metric sorts your list and what “underperforming” means.
| Goal | Main metric | What a problem page looks like |
|---|---|---|
| Recover lost search traffic | Search Console clicks, compared across periods | Clicks falling, especially on pages that used to be strong |
| Get more leads or sales from content | GA4 key events by landing page | Decent traffic, few or no key events |
| Cut dead weight | Clicks, links and key events together | Nothing on any of them for a year |
| Fix overlap | Queries shared by two or more of your pages | Two URLs taking turns to rank for one query |
This guide follows the first goal, recovering lost traffic, and covers the others along the way.
Then set the scope. Decide which page types count: blog posts only, or product, category and help pages too. Leave out pages you cannot change, such as legal pages and login screens. On a large site, one section (for example everything under /blog/) is plenty for a first audit. Write the goal, the scope and today’s date at the top of the sheet, because you will need that date when you measure results.
Step 2: Build your content inventory
The inventory is one row per URL. You can build it in two ways.
Crawl the site
A crawler such as Screaming Frog starts at your home page, follows links and records every URL it finds. For each one you get the status code, title, meta description, H1, word count, canonical and whether the page is indexable. A crawl also shows pages your sitemap forgot. The free version caps how many URLs it will crawl, so a large site needs the paid licence or a different crawler.
- Enter your home page URL and start the crawl.
- When it finishes, open the Internal tab and filter to HTML.
- Export the results. Keep URL, status code, indexability, title, H1, word count and canonical.
- Delete the rows you scoped out, such as tag archives, pagination and internal search results.
Start from the sitemap
On a small site this is quicker. Most sites publish a sitemap at /sitemap.xml or /sitemap_index.xml. WordPress’s built-in sitemap lives at /wp-sitemap.xml. In Google Sheets you can pull every URL from a sitemap file with one formula:
=IMPORTXML("https://example.com/post-sitemap.xml", "//*[local-name()='loc']")A sitemap has a weakness: it lists what your CMS thinks exists. It misses stray URLs, it can include pages you meant to exclude, and it gives you no status codes.
Check the count before you go further
Compare your total with the indexed count in Search Console under Indexing > Pages. A website page counter is another quick sanity check. Say your crawl finds 800 URLs but Search Console reports 2,000 indexed. Then something on your site is generating pages you did not know about, usually parameters, tag archives or old paths. Find out what before you measure anything.
Last, normalise every URL to one form: https, the same trailing slash rule, lowercase, no tracking parameters. You will join several exports on the URL column, and /guide and /guide/ will not match.
Step 3: Pull the metrics that matter
You do not need every metric that exists. These are the ones that change a decision.
| Metric | Source | What it tells you |
|---|---|---|
| Clicks | Search Console | Search traffic the page actually won. Your main decay signal. |
| Impressions | Search Console | How often the page was shown. Separates a demand or ranking drop from a click-through drop. |
| Average position | Search Console | A rough ranking. Read it per query: a page that picks up new low-ranking queries can see its average fall while its clicks grow. |
| CTR | Search Console | Whether searchers pick you when they see you. |
| Top queries | Search Console | What the page really ranks for, as opposed to what you wrote it for. |
| Engagement rate, key events | GA4 | Whether visitors do anything. Decides whether a low-traffic page still earns its place. |
| Referring domains | Search Console Links report, Ahrefs, Semrush | Whether the page has links worth keeping with a redirect. |
| Status, indexability, word count, last updated | Crawler, CMS | The page’s technical state and age. |
Where each export comes from
- Search Console: Performance > Search results > Pages tab. Set the comparison dates first (step 4), then export. The interface exports at most 1,000 rows. On a bigger site, filter by page (URLs containing
/blog/, for example) and export in parts, or use the Search Console API or the Looker Studio connector. - GA4: Reports > Engagement > Landing page. If your property does not show that report, build one in Explore with the Landing page dimension. Add a filter for Session default channel group = Organic Search if you only want search visits. Export from the share icon.
- Links: Search Console > Links > Top linked pages (under External links) is free. Ahrefs and Semrush give referring domains per URL, which is more detail than most audits need.
The tools you need
| Tool | Use it for | Needed? |
|---|---|---|
| Google Search Console (free) | Clicks, impressions, position, CTR, queries per page, indexing, external links | Yes |
| GA4 (free) | Engagement, key events, visits from other channels | Yes |
| Screaming Frog or another crawler | Full URL list, status codes, titles, word count, canonicals | Yes, unless the site is small enough for the sitemap route |
| Ahrefs or Semrush | Referring domains per page, competitor pages | Helpful, not required |
| A spreadsheet | Joining exports, flags, decisions | Yes |
A Search Console dashboard such as SEO Gets can replace the exports and the joining, but it stops at the list of pages: the plan, the rewrite and publishing are still yours. Here is how Flowra compares with SEO Gets if you want those steps done in one place.
To join the exports to your inventory, use a lookup on the URL. With the inventory URL in column A and a Search Console export on a tab called GSC:
=XLOOKUP(A2, GSC!A:A, GSC!B:B, 0)The 0 at the end means “no row found”, and that matters. Search Console only lists pages that got impressions, so any inventory URL that returns 0 had no search visibility in that period. Put those URLs on a separate list and check them in the Page indexing report before you judge their content.
Step 4: Choose a comparison window (and handle seasonality)
Decay means clicks falling over time, so the first question is: over what time? Look around and you will find conflicting rules. Some say eight weeks of decline in a row, some say the last 16 weeks against the previous 16, and some say a drop of more than 20% year on year. Each rule is a fair answer to a different question, and none of them come with the reasoning.
| Rule | What it tests | Weakness |
|---|---|---|
| N weeks of decline in a row | Consistency: one bad week is noise, eight in a row is a trend | Needs weekly numbers per page, which means the API or a pile of exports |
| Long window vs the previous long window (e.g. 16 weeks) | Direction, with daily noise smoothed out | On a seasonal site it compares summer with spring and calls the difference decay |
| Year on year | Change with seasonality removed | Needs a page older than the window plus a year; a one-off spike last year makes a normal page look like it is falling |
| A fixed threshold (e.g. down 20%) | Size of the drop | On a page with 20 clicks, 20% is 4 clicks, which is noise. On a page with 20,000 clicks, a 10% drop is worth a look. |
A setup that holds up
- Compare equal, whole weeks when you can. If weekends behave differently on your site, use 28 day or 12 week ranges so both periods contain the same number of each weekday.
- Run two comparisons, not one. Compare the last 3 months with the previous 3 months, then with the same 3 months last year. Search Console keeps 16 months of Performance data, which is enough for both. Under Date > Compare there are presets for the previous period and for year over year.
- Set a floor. Ignore pages below a minimum number of clicks in the earlier period. Choose the floor so your list stays workable. For a mid-size blog, 50 or 100 clicks is a reasonable place to start.
- Adjust for the whole site. If the whole site is down 10%, a page down 10% is holding its share. What you care about is how each page moved compared with the site.
Then read the two comparisons together:
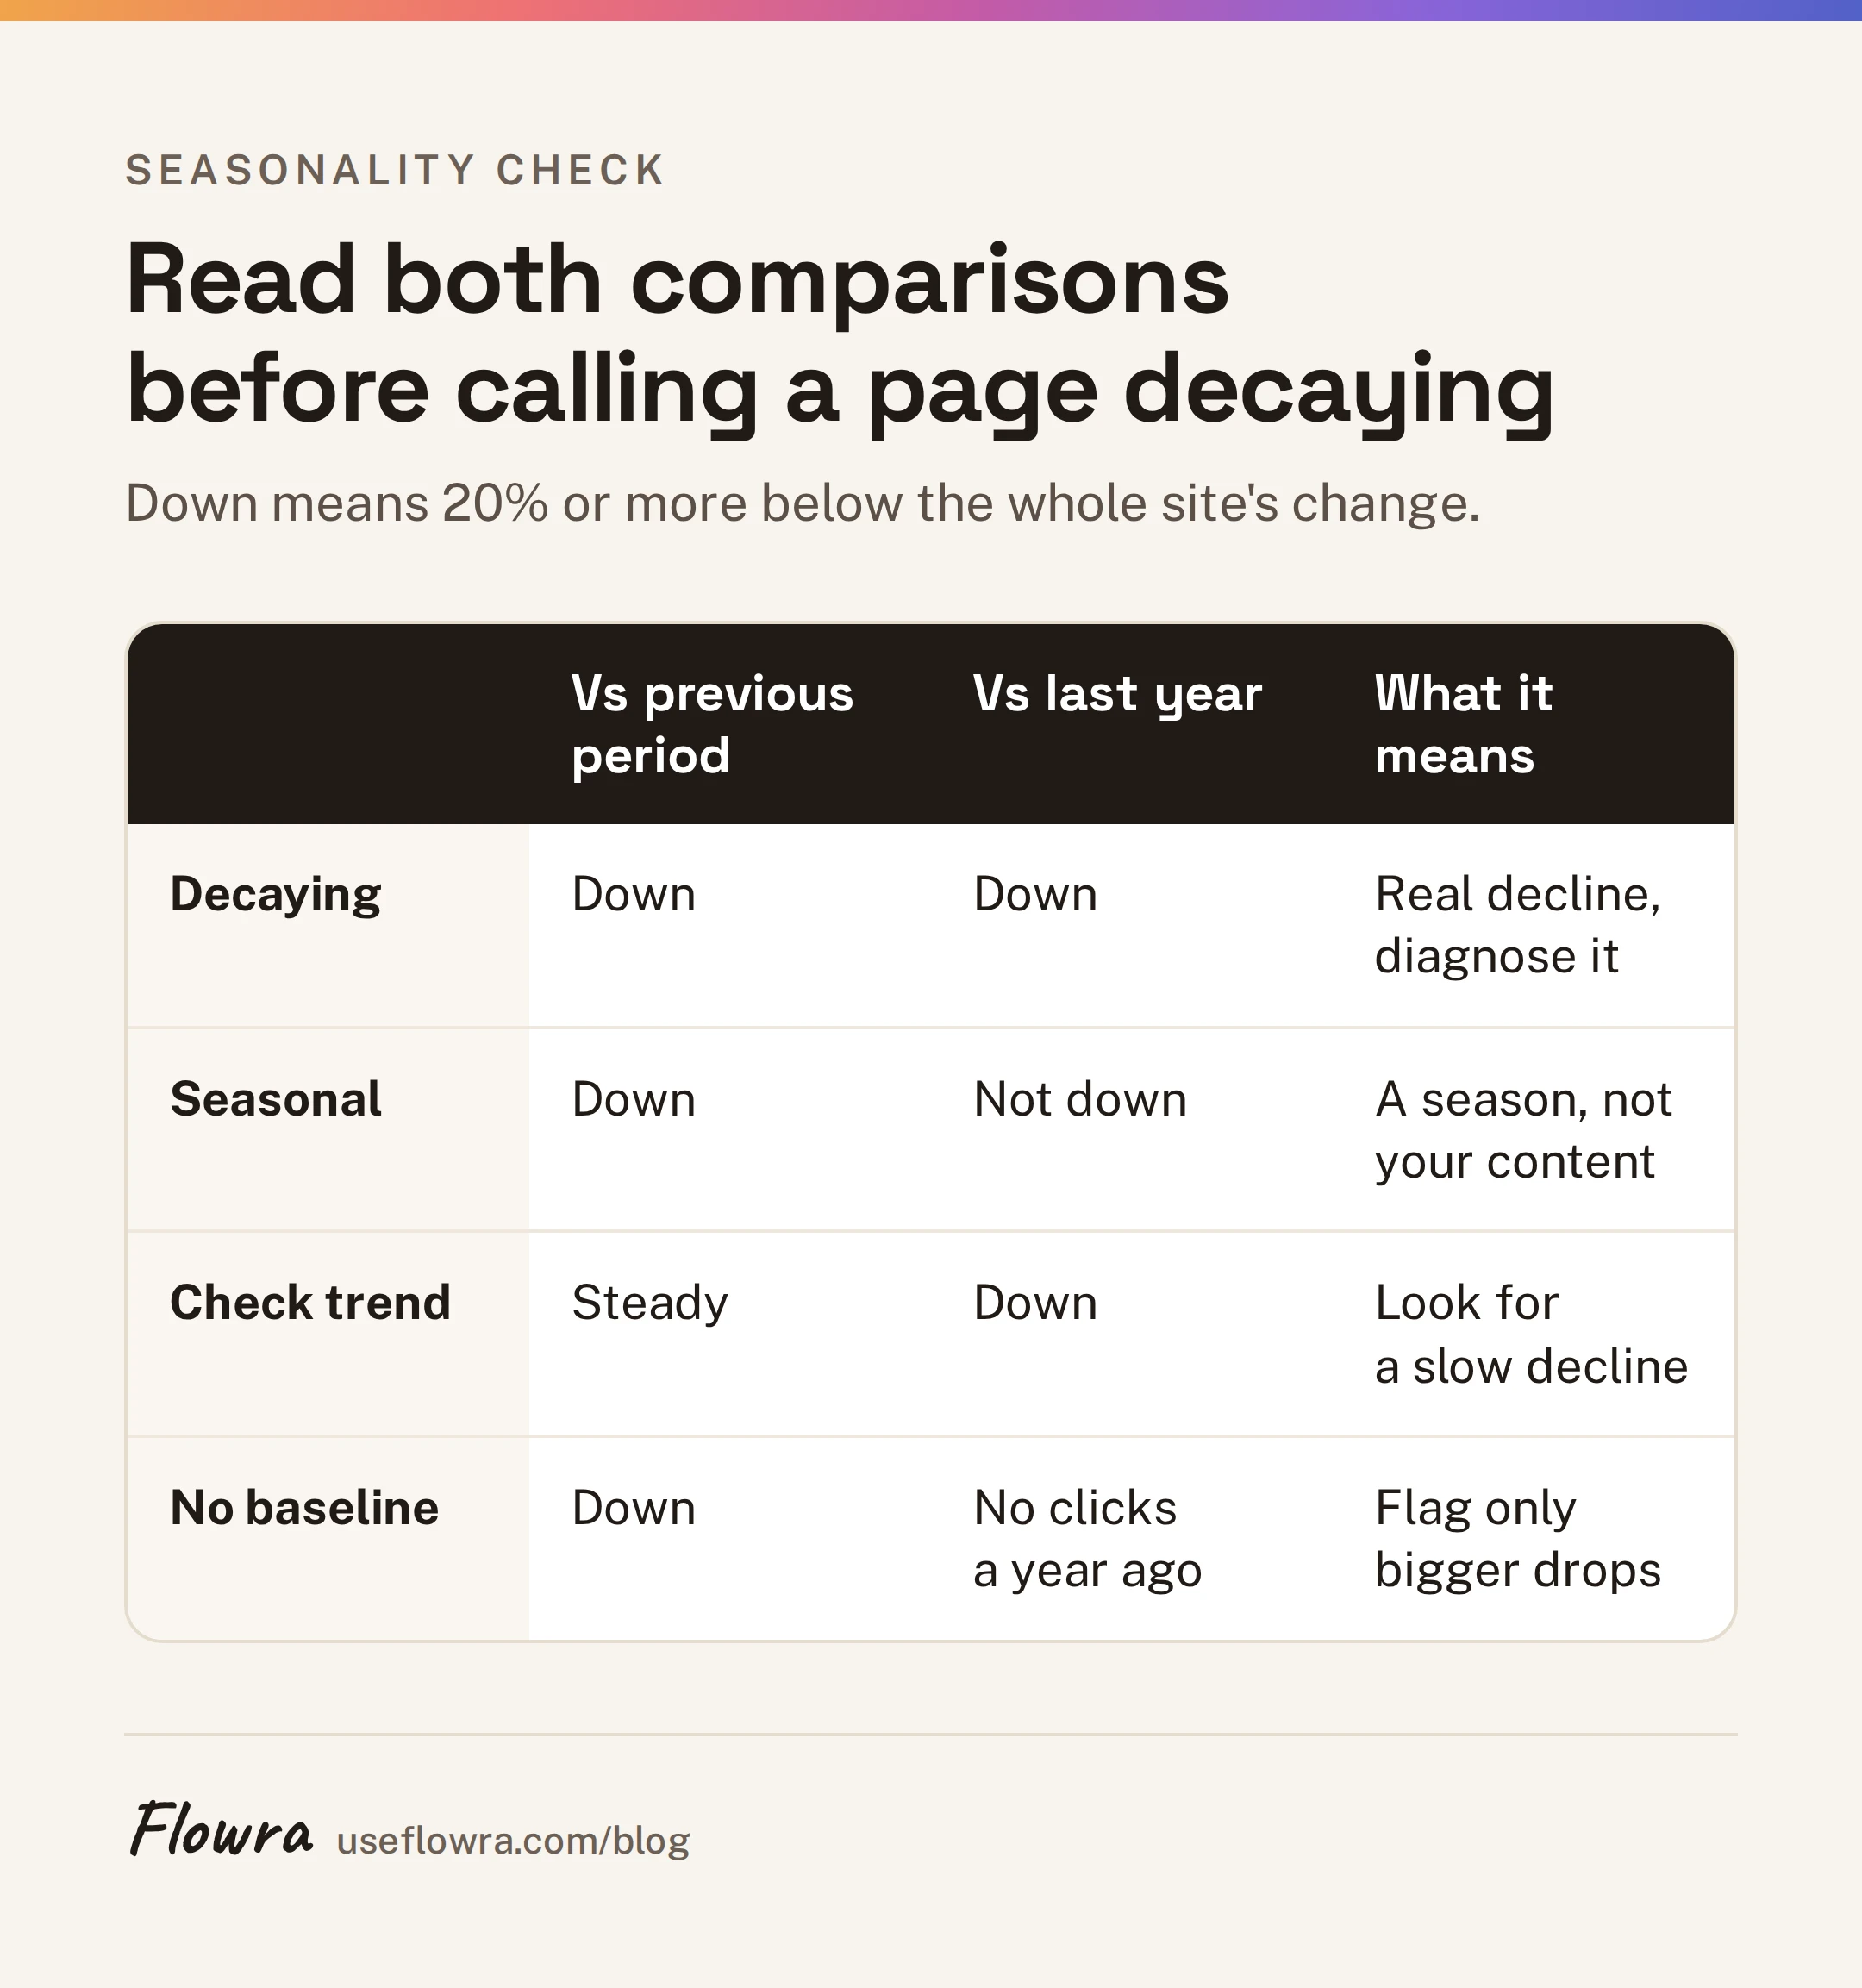
| Last 3 months vs previous 3 | Last 3 months vs same period last year | What it probably means |
|---|---|---|
| Down | Down | Real decline. Diagnose it. |
| Down | Flat or up | Seasonal. Leave it and check again next cycle. |
| Flat or up | Down | A slow slide, or last year was a spike. Look at the monthly trend. |
| Flat or up | Flat or up | Fine. |
For a second view on seasonality, look up the page’s main query in Google Trends. If interest in the topic dips every July, a July drop is not your content’s fault. The site-wide Performance chart over 16 months shows the same thing for the whole site: dips that repeat each year are seasons, not decay.
Pages younger than about 15 months have no year-on-year baseline. Judge them on the period-over-period comparison only, and set a higher bar before you call them decaying.
Step 5: Find the pages losing traffic in Search Console
This is the decay check, done with free tools.
- Open Search Console > Performance > Search results and set the search type to Web.
- Click the date filter, open Compare, and choose the last 3 months against the previous period. Apply it.
- Switch on Total clicks and Total impressions, then open the Pages tab.
- Export to Google Sheets. The export has a column for each period.
- Change the comparison to the same 3 months last year, then export again.
- Join both exports to your inventory with XLOOKUP, as in step 3.
- Add the formulas below and filter on the flag.
Put each period’s clicks in its own column: C for the previous 3 months, D for the last 3 months and E for the same 3 months last year. In K1, put the whole site’s change against the previous period. In K2, put its change year on year. Work both out from the total clicks in the Search Console chart. Then add:
F, change vs site:        =IF(C2=0, "", (D2/C2)/(1+$K$1)-1)
G, year on year vs site:  =IF(E2=0, "", (D2/E2)/(1+$K$2)-1)
H, flag:                  =IF(C2<100, "Below floor", IF(NOT(ISNUMBER(G2)), IF(F2<=-0.2, "No baseline: check", ""), IF(AND(F2<=-0.2, G2<=-0.2), "Decaying", IF(F2<=-0.2, "Seasonal", IF(G2<=-0.2, "Check trend", "")))))
The flag follows the reading table in step 4:
- Decaying: down in both comparisons.
- Seasonal: down against the previous period, but not against last year.
- Check trend: steady against the previous period, but down against last year.
- No baseline: check: down against the previous period, with no clicks a year ago to compare with.
- Below floor: fewer than 100 clicks in the previous period.
A page down 30% while the site is down 10% comes out at about 22% down relative to the site (0.7 / 0.9, minus 1). The column letters are only for this example, so match them to your own sheet. The 100 click floor and the 20% line are starting points, not laws. Move them until the flagged list is a size your team can actually work through this cycle.
A worked example
Made-up numbers for four pages on a site with flat traffic overall, so each page’s change and its change relative to the site are the same:
| Page | Previous 3 months | Last 3 months | Same 3 months last year | Change | Year on year | Flag | Next step |
|---|---|---|---|---|---|---|---|
| /guide-a | 3,200 | 2,100 | 3,000 | -34% | -30% | Decaying | Diagnose it (step 6) |
| /guide-b | 1,500 | 900 | 950 | -40% | -5% | Seasonal | Leave it, recheck next cycle |
| /guide-c | 800 | 776 | 1,400 | -3% | -45% | Check trend | Look at the monthly clicks |
| /guide-d | 40 | 12 | 35 | -70% | -66% | Below floor | Judge it on purpose, not decay (step 7) |
A single period-over-period check would have sent /guide-b to a rewrite and missed /guide-c. With both comparisons, /guide-b is marked Seasonal and /guide-c is marked Check trend. That is your cue to open its monthly clicks and see whether the slide is steady or last year was a one-off spike. If it is steady, treat it as decaying.
While you are in the Queries tab, also note pages ranking roughly 8 to 20 for queries with plenty of impressions. They are not decaying. They are the cheapest updates on your list, so give them their own flag.
Step 6: Diagnose why each page dropped
This is where the qualitative audit starts, and it is the step most audits skip. When you ask why your organic traffic dropped, the same drop can have four or five different causes. A rewrite only fixes some of them.
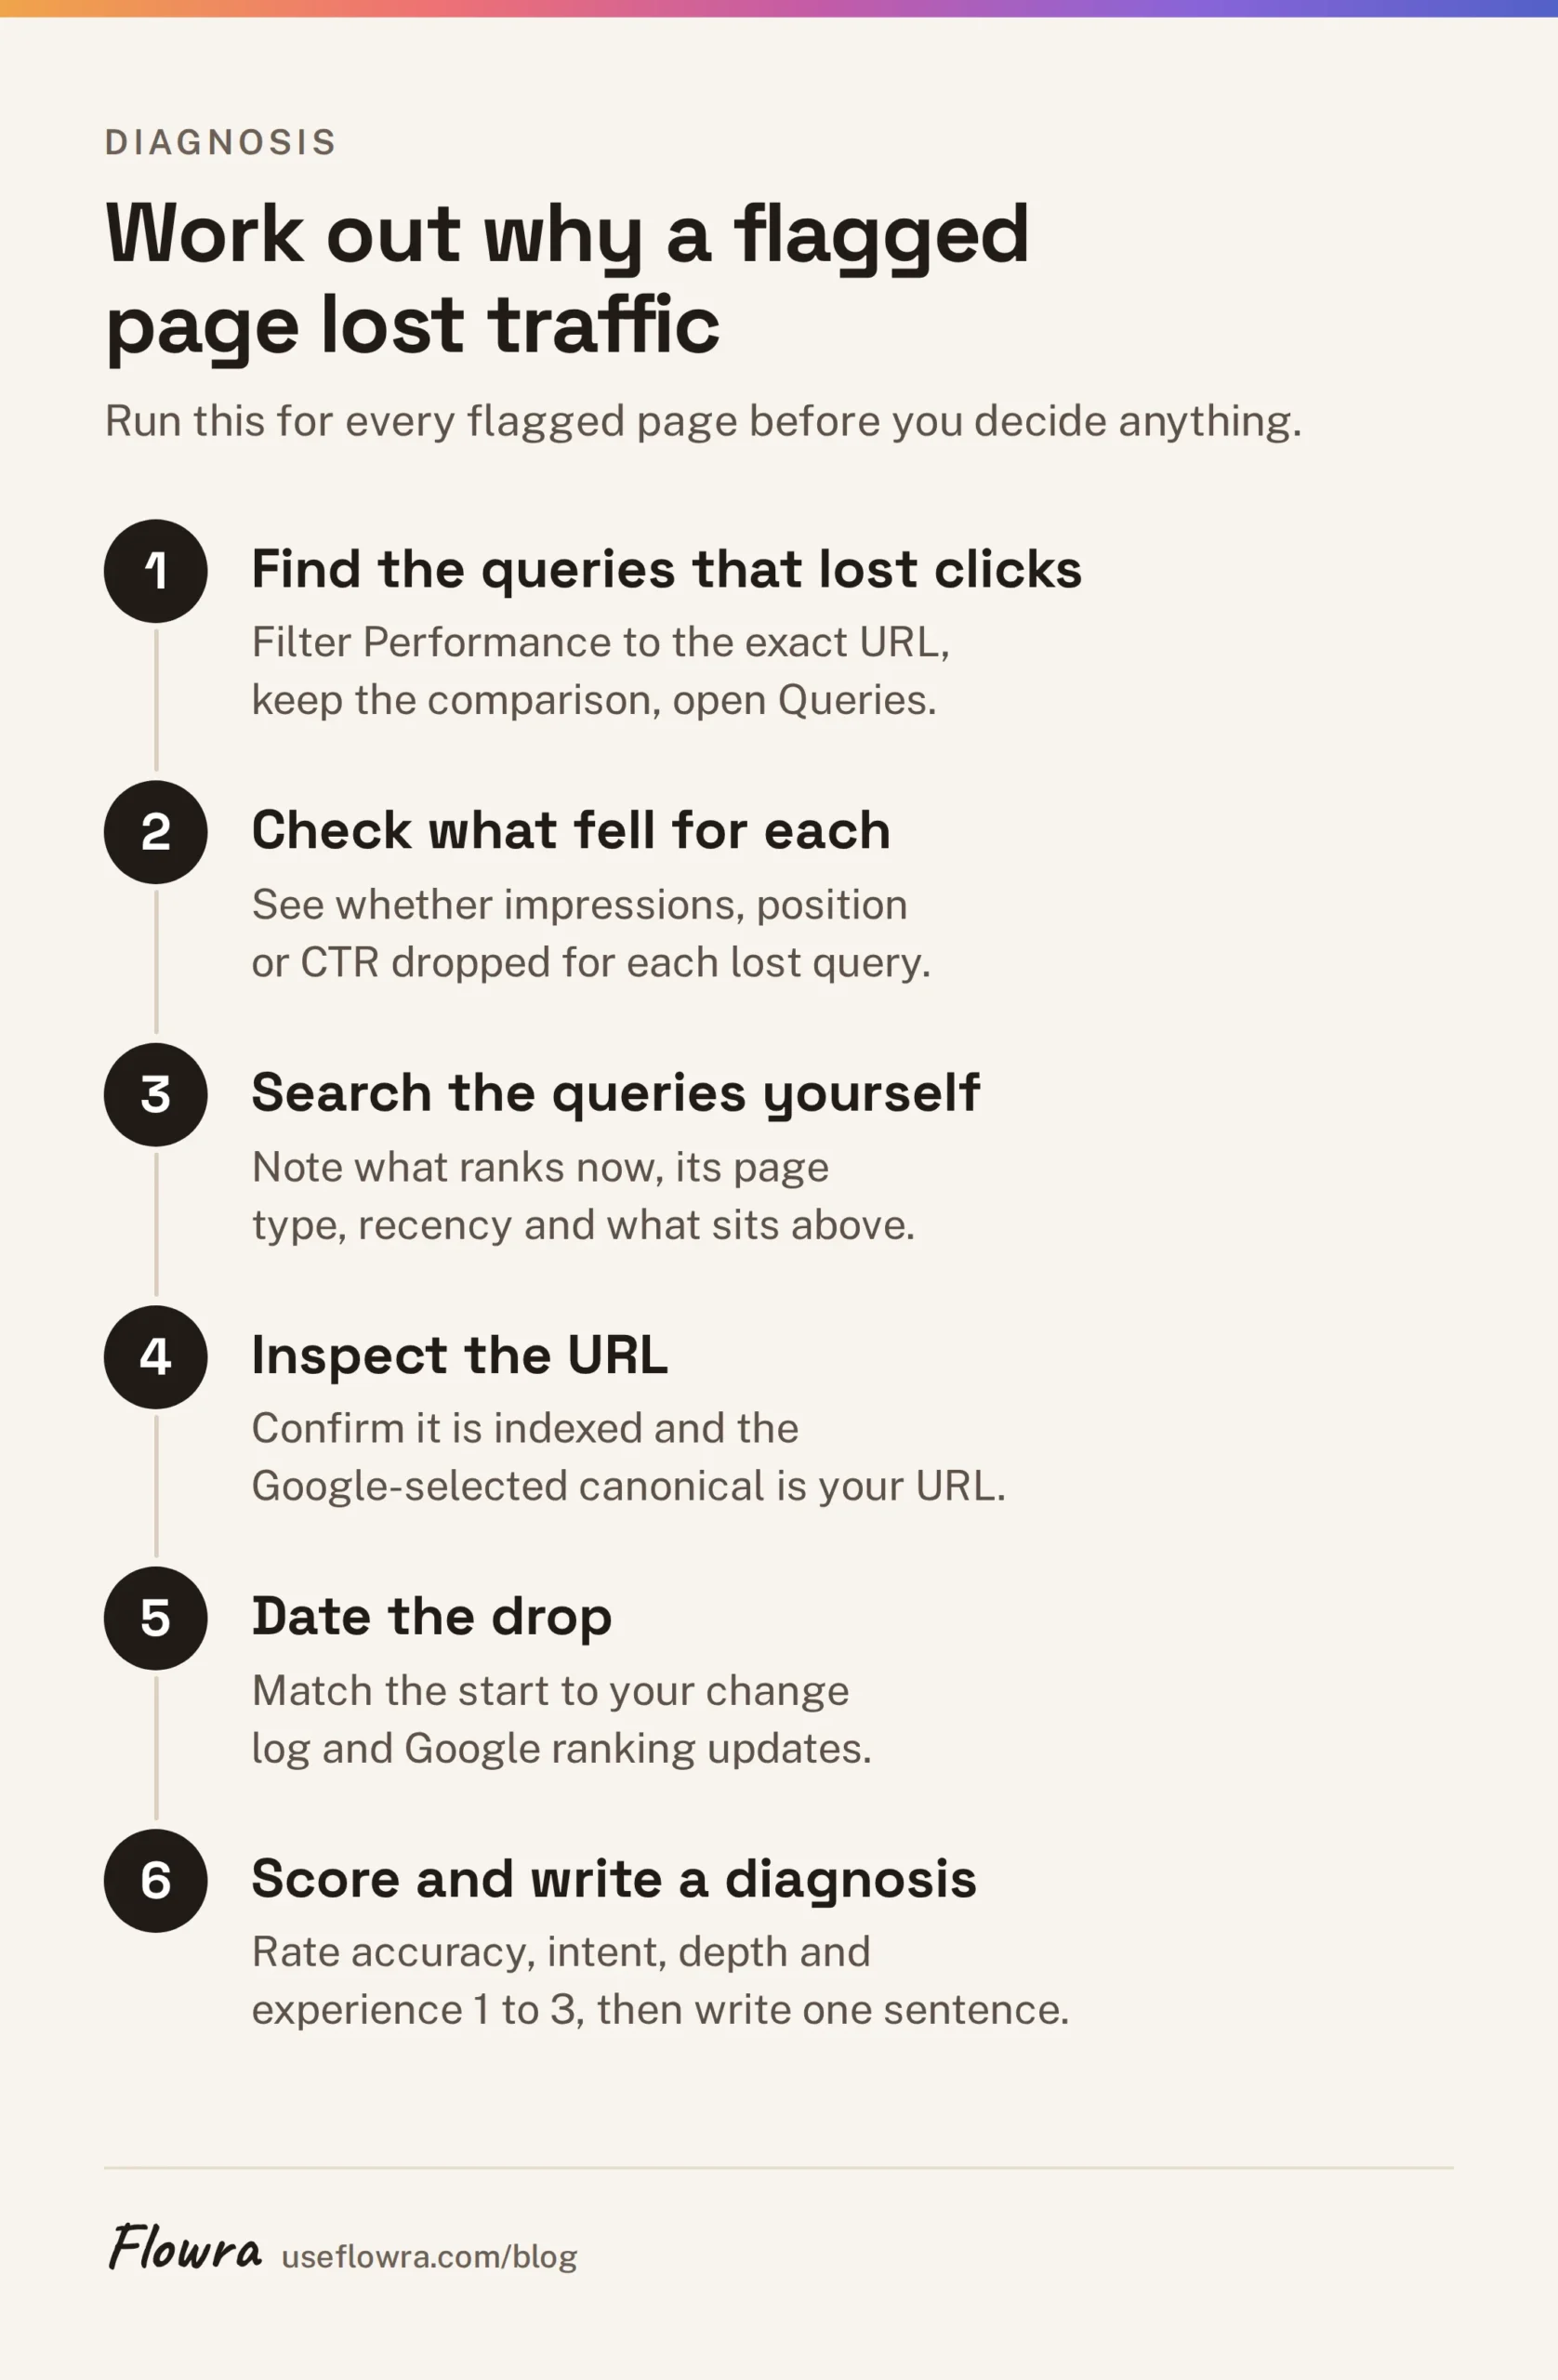
For each flagged page:
- In Performance, add a Page filter set to the exact URL, keep the comparison, and open the Queries tab. Find which queries lost the clicks. It is usually a handful, not all of them.
- For each of those queries, see whether impressions fell, position fell or CTR fell.
- Search those queries yourself. Note what ranks now, what kind of page it is, when each article was published, and what sits above the results.
- Check the page with URL Inspection. Is it indexed? Is the Google-selected canonical your URL?
- Look at when the drop started. Compare the date with your own change log (redesign, migration, redirects, template changes) and with the ranking updates on the Google Search Status Dashboard.
Then match what you found to a cause:
| What you see | Likely cause | Fix |
|---|---|---|
| Clicks and impressions down, position steady, lower interest in Google Trends | Demand fell, or it is seasonal | Nothing, or broaden the page to nearby questions |
| Position down for the main queries, newer or fuller pages above you | A stronger competitor | Update: fill the gaps, add what only you know |
| Position down, and the top results are now a different kind of page (tool, list, product page) | Intent shift | Change the format or retarget the page |
| Old years, prices, screenshots or features on the page | Outdated content | Update the facts, then the date |
| Impressions and position steady, CTR down | Search features above you, or a weaker title | Rewrite the title and description, aim for the snippet |
| Clicks near zero from one specific date | Technical: noindex, wrong canonical, redirect, removal, broken template | Fix the technical problem first. Do not rewrite. |
| Two of your URLs take turns ranking for one query | Cannibalization | Merge or clearly separate them |
| GA4 organic sessions down, Search Console clicks steady | Tracking, consent or tagging | Fix tracking. It is not an SEO problem. |
For the reading itself, Google’s guidance on helpful, people-first content has a list of self-assessment questions that work well as a checklist. Score each flagged page 1 to 3 on accuracy, intent match, depth compared with the top results, and first-hand experience. Then write one sentence in the Diagnosis column. If you cannot write that sentence, you are not ready to decide.
Step 7: Decide to keep, update, merge or delete
Apply these rules in order and stop at the first one that fits. The order matters. It stops you rewriting a page that was never indexed, or deleting a page whose only problem was the month you looked at it.
- Is there a technical problem? Fix that first. Hold off on any content decision until the page is indexed with the right canonical, then check it again next cycle.
- Is the drop seasonal or a fall in demand, with nothing wrong on the page? Keep it.
- Does another of your pages serve the same intent? Merge them. Keep the URL with more clicks and links. Move over anything useful that only the weaker page has. Redirect the weaker URL with a 301 (Google’s redirect documentation covers the options) and update internal links to point at the survivor.
- Did it lose ground to a competitor, go out of date or miss a shift in intent, while the topic still matters to you? Update it. Keep the URL. Keep the sections that still win queries, and rewrite the ones that fail, following our guide on how to update old blog posts.
- No clicks, no links, no key events, no job outside search, and no realistic fix? Delete it. If it has links or a close equivalent page, redirect it there. If not, let it return a 404 or 410 (how Google treats status codes). A redirect to an unrelated page helps nobody.
- Anything left: keep it and note why.
One special case: some pages matter to users but not to search, such as thin tag archives or pages you send people to from email. Keep those pages and add a noindex tag rather than deleting them.
| Decision | Use when | What to do | Watch out for |
|---|---|---|---|
| Keep | Stable or growing, a seasonal dip, or it has a job outside search | Nothing, or small fixes like internal links | Checking it again next cycle |
| Update | Lost clicks to stronger pages, outdated facts, or an intent shift | Rewrite the failing sections, keep the URL | Changing the URL, or changing only the date |
| Merge | Two or more pages share one intent, or thin pages belong together | Combine into the stronger URL, 301 the rest, fix internal links | Merging pages that serve different intents |
| Delete | No traffic, links, key events or purpose, and no fix | 301 to a close match if it has links, otherwise 404 or 410 | Deleting before checking links and conversions |
Content audit template: the columns to use
Here is a free template you can copy. Paste this line into cell A1 of a new Google Sheet, then choose Data > Split text to columns.
URL,Section,Status code,Indexable,Title,Word count,Last updated,Clicks previous 3 months,Clicks last 3 months,Change,Change vs site,Clicks same 3 months last year,Year on year vs site,Impressions change,Top query,Position for top query,Engagement rate,Key events,Referring domains,Flag,Diagnosis,Decision,Merge or redirect target,Owner,Date changed,Clicks 8 weeks afterWhat each group of columns is for:
| Group | Columns | Filled from |
|---|---|---|
| Inventory | URL, section, status code, indexable, title, word count, last updated | Crawler or sitemap, your CMS |
| Search | Clicks for each window, both change columns, impressions change, top query, position | Search Console |
| Behaviour | Engagement rate, key events | GA4 |
| Links | Referring domains | Search Console Links report or a backlink tool |
| Decisions | Flag, diagnosis, decision, target, owner | You |
| Results | Date changed, clicks 8 weeks after | You, then Search Console |
The last two columns are the ones most templates leave out. Without a change date you cannot tell whether an update worked.
Find decaying pages without rebuilding the sheet
The period-over-period export is the part you redo every cycle. If you would rather not rebuild it each quarter, connect Search Console to Flowra. The content decay report is on the Free plan. It lists the pages whose clicks and impressions are falling, with each page’s recent clicks and its change against the prior period. You set the threshold and the period with filters instead of editing formulas.
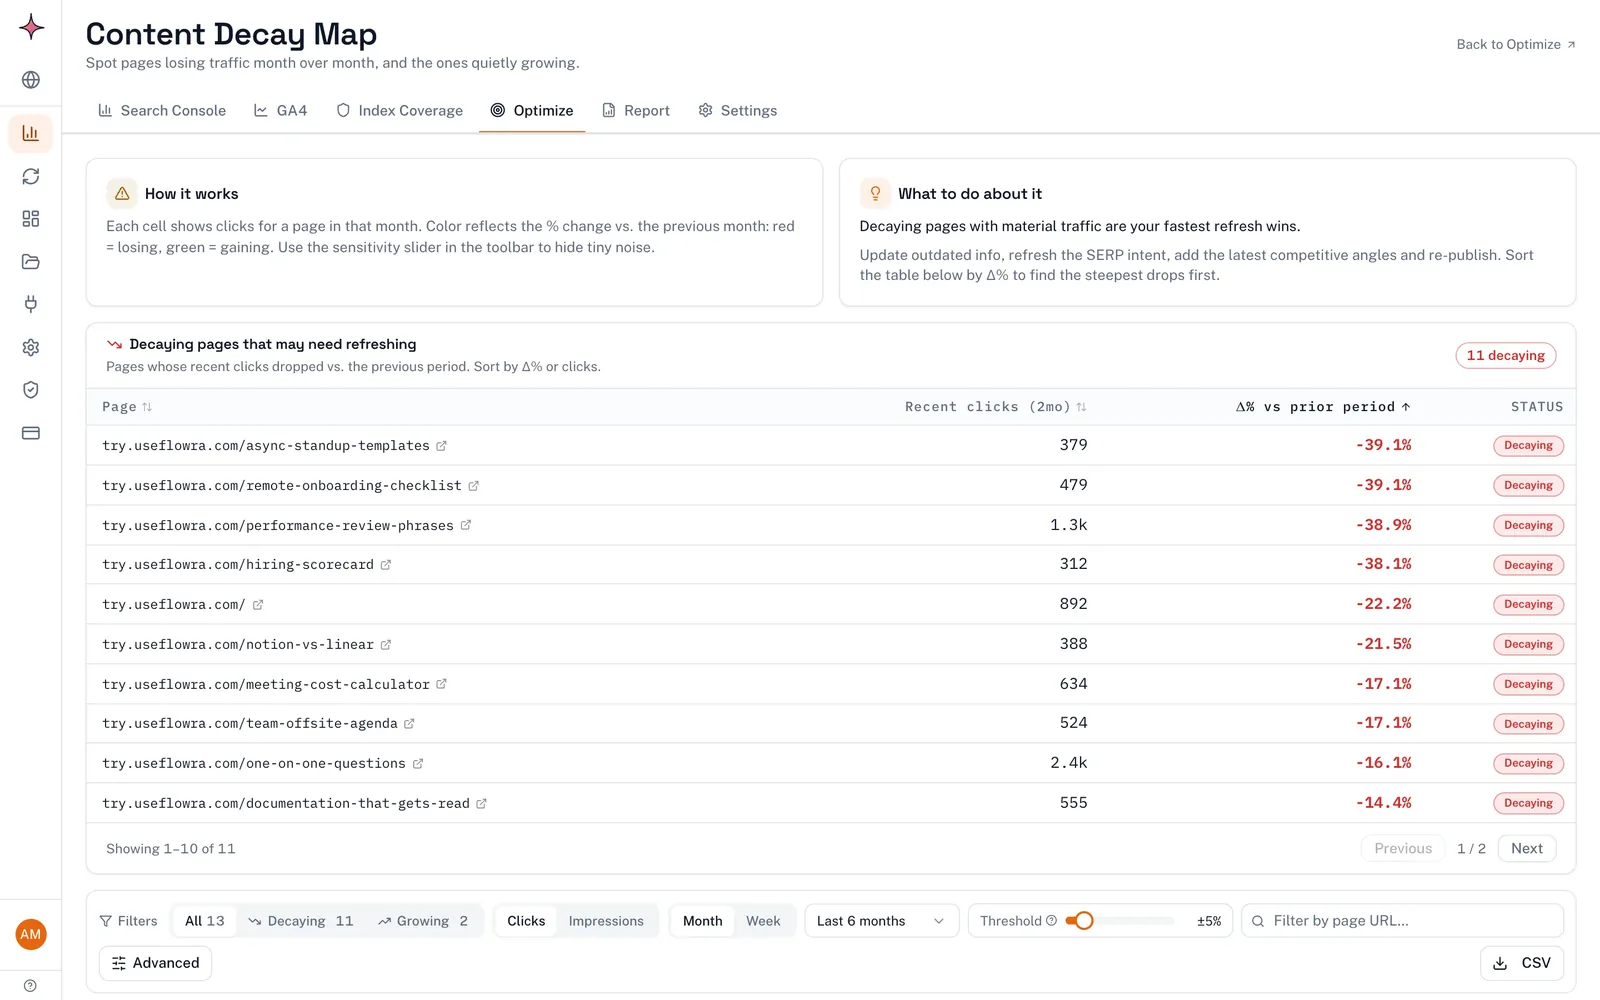
The report compares each page with the prior period. The year-on-year check and the whole-site adjustment from step 4 are still yours to do, so keep those two columns in your sheet for the pages it lists. It also does not replace steps 2, 3 and 6. It does not crawl your site or pull backlinks, and it only knows about pages that appear in Search Console. You still need a crawler or sitemap for the full inventory, a link check before you delete anything, and a person reading each page to diagnose it.
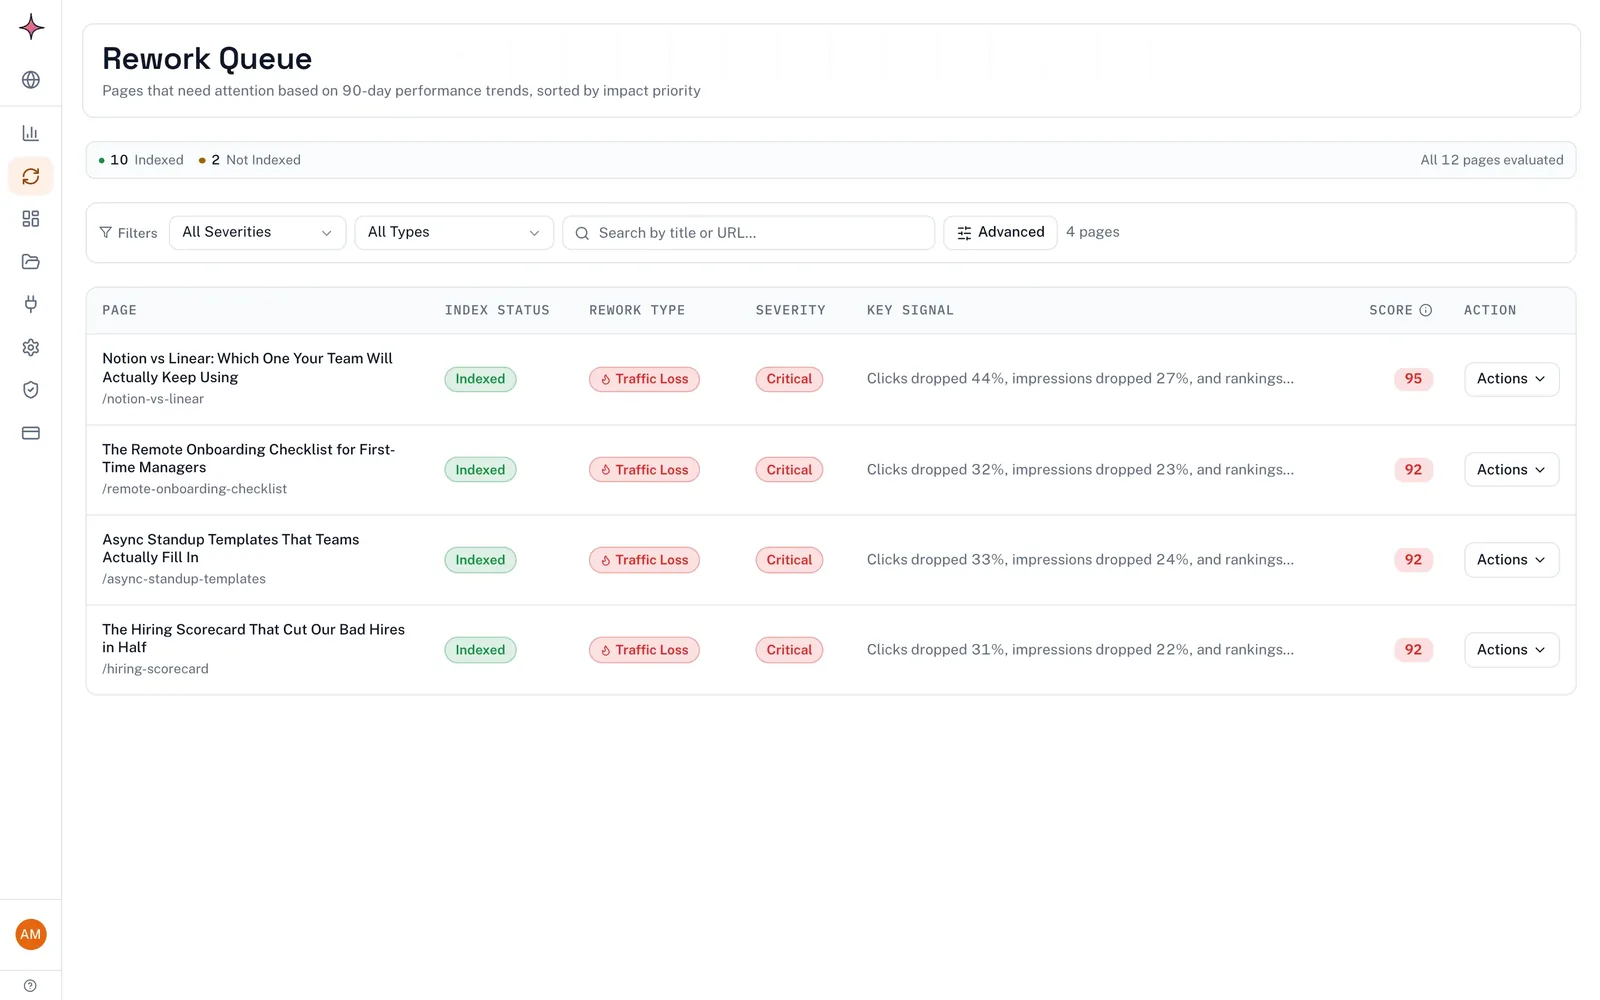
On the Pro plan, pages that lost traffic also go into a Rework Queue sorted by impact. Each row shows the page’s index status and the signal that flagged it. The rework rewrites only the sections that need it and shows you the changes before it publishes to WordPress (this part needs a WordPress site). After you change a page, you can tag the change and get a before-and-after comparison with a 14 day settling window, adjusted for the whole site’s movement. It is a before-and-after reading, not a split test.
Connect Search Console and see which of your pages are decaying.
Common content audit mistakes
- No goal. Without a goal you cannot sort the list, so every page looks equally important and nothing gets done.
- Comparing one month with the month before. That compares seasons and weekday counts, not performance. Use two windows, as in step 4.
- Trusting percentages on tiny numbers. A page that went from 10 clicks to 5 has “halved”. Set a floor.
- Deleting every zero-traffic page. Some of those pages convert visitors from email, earn links or answer support questions. Check key events and links first.
- Rewriting before diagnosing. If the page dropped out of the index, the best rewrite in the world will not bring it back. Technical checks come first.
- Using GA4 alone to spot decay. GA4 mixes channels and depends on consent and tagging. Search Console clicks are the cleaner signal for search.
- Merging without redirects. If you merge two pages and leave the old URL returning 404, you lose its links and its visitors.
- Changing the date and nothing else. A new date on old content gives readers nothing new, and they notice, so fresh content SEO needs real changes behind the date.
- Not logging the change date. Without it, eight weeks later nobody can say which change moved which page.
What to do after your audit
Start small. Take the ten flagged pages that lost the most clicks, not the biggest percentage drop, and work through steps 6 and 7 for those first. Fix every technical cause before you touch content. Then give each update an owner and a date in the sheet.
Measure each change against a period of the same length before it. Allow for the fact that Google has to recrawl the page and rankings can move around for a couple of weeks. Checking at about 4 weeks and again at 8 weeks gives you an early read and a settled one. Compare each page with the site’s overall movement over the same weeks, just as you did in step 4.
After that, set a rhythm. Run the decay check (steps 4 to 6) monthly or quarterly, and the full audit, inventory included, about once a year.
Frequently asked questions
What is a content audit?
A content audit is a page-by-page review of a site’s published content, measured against a goal such as recovering search traffic. It combines numbers (clicks, impressions, engagement, links) with a person reading the flagged pages. Every page ends with a decision to keep, update, merge or delete it.
How often should I run a content audit?
Most sites do well with a full audit, including a fresh inventory, about once a year. The decay check, which compares Search Console clicks across two date windows, is quicker and worth running monthly or quarterly. Busy sites that publish often should lean towards the shorter cycle.
How long does a content audit take?
It depends mostly on how many pages need a qualitative read, not on the total page count. Once the exports are joined, the quantitative pass is quick. To estimate the rest, review 10 flagged pages, time yourself, and multiply by the number of flagged pages.
What tools do I need for a content audit?
You need Google Search Console and GA4, which are both free, plus a spreadsheet. On larger sites add a crawler such as Screaming Frog to build the inventory. A backlink tool such as Ahrefs or Semrush is useful before you delete pages, but the free Links report in Search Console covers the basics.
Should I delete pages that get no traffic?
Not automatically. First check whether the page earns links, drives key events in GA4, or has a job outside search such as supporting customers or email campaigns. Delete only when it has none of these and no realistic fix, and redirect it to a close match if it has any links.
Does a content audit actually improve SEO?
The audit itself changes nothing. The fixes it leads to are what can improve search traffic: repairing technical problems, updating pages that fell behind, and merging pages that competed with each other. The reliable way to know whether it worked on your site is to log each change and compare clicks before and after, adjusted for the whole site’s movement.