Organic traffic usually drops for one of a short list of reasons: a tracking or reporting glitch, seasonal demand, a Google update, a technical fault such as an accidental noindex or missing redirects, a manual action, or a change in the search results that takes clicks even though you still rank. To find out why your organic traffic dropped, check those causes in a fixed order. Start with whether the drop is real at all.
Google’s own guide to debugging drops in Search traffic names the same group: algorithmic updates, site-wide security or spam issues, seasonality, technical issues, changing interests and reporting glitches. It does not tell you which to check first. This page gives you that order. It starts with four checks that rule causes in or out. Then it splits into two paths, depending on whether your rankings fell or only your clicks did.
The usual causes, and where each one shows up
| Cause | What it looks like | Check first |
|---|---|---|
| Tracking or reporting glitch | GA4 falls but Search Console doesn’t, or other channels fall on the same day | GA4 tag, consent banner, GA4 settings |
| Seasonality or falling demand | Impressions fall, position holds, same dip last year | 16 months of Search Console, Google Trends |
| Google update | Many pages and queries lose position from the same date | Google Search Status Dashboard |
| Manual action or security issue | Sharp, site-wide fall | Search Console > Security & Manual Actions |
| Technical fault | Impressions for some pages fall to near zero | Indexing > Pages, URL Inspection, Crawl stats |
| Redesign or migration | Drop starts on launch day, old URLs return 404 | Redirect check on the old URL list |
| Lost backlinks or stronger competitors | Gradual position loss on key pages | Links report, the live results |
| Content decay or intent shift | Slow slide on older pages, no clear date | Page-by-page comparison |
| SERP changes and AI Overviews | Position and impressions steady, CTR down | Live results for your top queries |
Most drops match one row. Sometimes the decline is slow, spread across dozens of older pages, with no single date to point at. Then the diagnosis turns into a wider review. Our guide on how to do a content audit covers that process from inventory to decisions.
Step 1: Is the drop real, or a tracking problem?
Before you look for a cause in Google, rule out your own reporting. A broken tag can wipe out half your “organic traffic” overnight without a single visitor going missing.
- In Search Console, open Performance > Search results, click the date filter, choose Compare, and set the last 28 days against the previous 28 days. Note the change in clicks.
- In GA4, open Reports > Acquisition > Traffic acquisition, set the same dates with a comparison, and find the Organic Search row.
- Put the two changes side by side.
Read the result like this:
- Both fell by a similar share. The drop is real. Go to Step 2.
- GA4 fell, Search Console didn’t. Visitors still arrive from Google, but GA4 isn’t recording them. Check the tracking.
- Search Console fell, GA4 didn’t. This is less common. Check whether Google has announced a Search Console data issue for those dates. Also check whether Bing or other engines grew, since GA4 counts them as organic too.
If tracking is the suspect, check these in order:
- Is the GA4 tag still on every template? A theme update or a new page builder often drops it.
- Did a consent banner change go live, so fewer visitors are tracked?
- Did someone add a data filter or edit the channel grouping in GA4?
- Did pages move to a hostname or subdomain the tag doesn’t cover?
One quick tell: if Direct, Referral and Organic Search all fell in GA4 on the same day, the cause is almost always the tag, not Google.
The two tools never match exactly, and that’s fine. Search Console counts clicks on Google Search results. GA4 counts sessions from every search engine, but only when the tag loads and the visitor allows tracking. What matters is whether the gap between them changed, not that a gap exists.
Step 2: Is it seasonality or a real drop?
Demand moves. People search for garden furniture in spring and for tax deadlines in a few weeks of the year, so a site can lose a large share of its clicks with nothing wrong. Google’s debugging guide suggests comparing the last 3 months with the previous period or with the same months a year earlier, and using a 16 month range to spot seasonal patterns.
- In Search Console Performance, set the date to Last 16 months and turn on clicks and impressions. Look for the same dip at the same time last year.
- Switch to Compare and set the last 3 months against the same 3 months last year. If this year’s curve follows last year’s shape at a similar level, it’s seasonal.
- Put your three to five main topics into Google Trends for your country over five years. If interest fell, your impressions will fall with it.
The Search Console signal for falling demand is specific: impressions drop while average position holds. You show up for the same searches in the same place, but fewer people are searching.
Google calls the lasting version of this “changing interests”. A product line ends, a trend fades, or the industry starts using a different term. No on-page fix brings that traffic back. The response is to cover what people search for now.
Step 3: Find where the drop lives
A site-wide number hides the cause. Split it before you form a theory, because each split points at a different culprit. In Search Console Performance, keep the date comparison on and use these tabs and filters.
| Split it by | How in Search Console | If the drop sits here, suspect |
|---|---|---|
| Branded vs non-branded | Add filter > Query > Custom (regex) with your brand names | Branded down: fewer people look for you, a marketing issue. Non-branded down: rankings or SERP changes |
| Page | Pages tab, sort by click difference | A few URLs: a technical fault, redirects, lost links or a competitor on those pages |
| Page type or folder | Add filter > Page > URLs containing, for example /blog/ | One section or template: a template change, noindex or redirect rule |
| Device | Devices tab | Mobile only: a mobile layout, rendering or speed problem |
| Country | Countries tab | One market: a local competitor, hreflang errors or a local update |
| Search appearance | Search appearance tab | A rich result you used to get, such as review stars |
For the brand split, use a regex such as acme|acme co|acmeco with “Matches regex” for branded queries. Then switch to “Doesn’t match regex” for everything else. Include common misspellings of your name.
Next, export the Pages tab for both periods (Export > Google Sheets) and add a column for the change in clicks. Often a handful of URLs account for most of the loss. If that’s true for you, your investigation just went from a whole site to five pages.
Step 4: Did your rankings drop, or only your clicks?
Now read the four Search Console metrics together, for the part of the site that lost traffic: clicks, impressions, average CTR and average position. The pattern tells you which path to take.
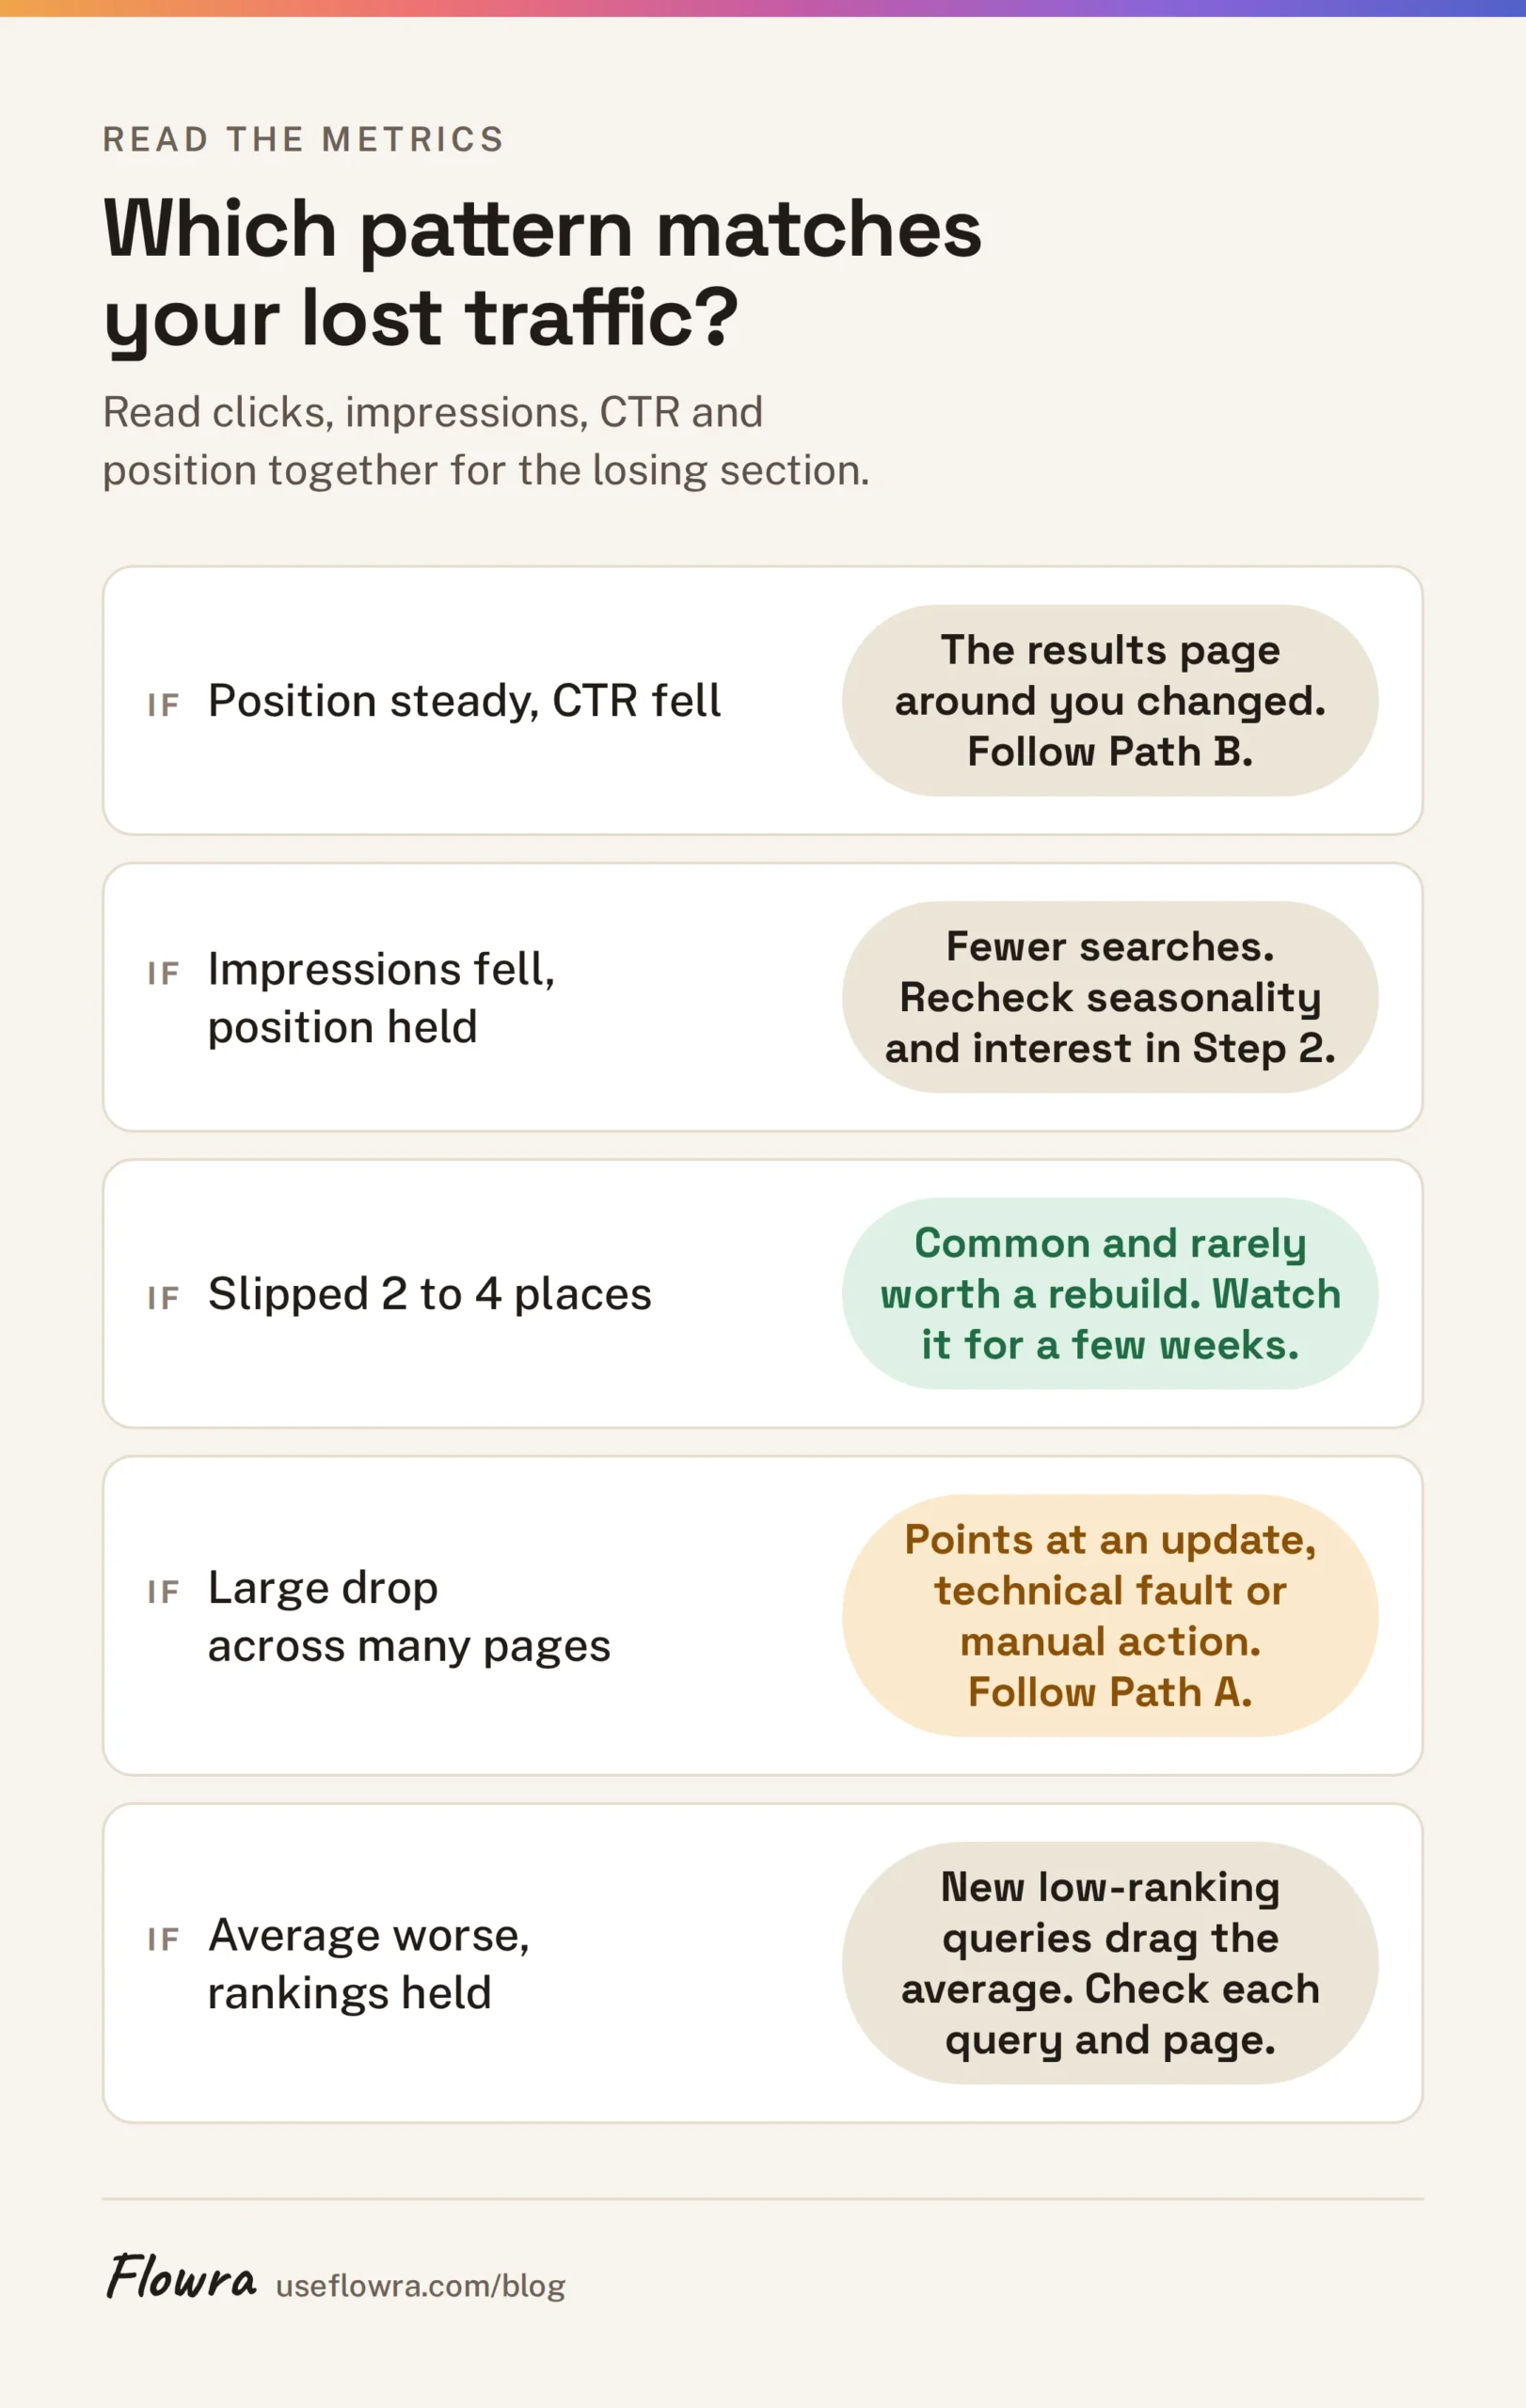
| Position | Impressions | CTR | Most likely | Go to |
|---|---|---|---|---|
| Steady | Down | Steady | Less demand or seasonality | Step 2 |
| Down | Down | Down or steady | Rankings fell | Path A |
| Steady | Steady | Down | Search results changed | Path B |
| No data | Near zero for some URLs | No data | Pages dropped out of the index | Path A, technical |
Judge the size of a ranking drop the way Google does. Its debugging guide separates a small drop, such as from position 2 to 4, from a large one, such as falling from the top 10 to around position 29. A small move like that is common and rarely worth a rebuild, so watch it for a few weeks. A large drop on many pages at once points at an update, a technical fault or a manual action.
One caveat: average position is weighted by impressions. If you start appearing for lots of new, low-ranking queries, your average gets worse even though no existing ranking moved. Check position per query and per page, not only the site total.
Path A: your rankings dropped
Did a Google update land on the same date?
Open the Google Search Status Dashboard, which lists ranking updates with their start and end dates. Updates roll out over days or weeks. Look for a drop that begins inside a rollout window and spreads across many pages and queries, not one URL.
If the dates match, there is usually nothing technical to fix. Core updates reassess how helpful and relevant pages are. Compare your losing pages with what now ranks above them and improve the content honestly. If only one section of the site lost, start there.
Is there a manual action or security issue?
In Search Console, open Security & Manual Actions and check both Manual actions and Security issues. A manual action is listed with its reason and the affected pages. A hacked site or malware warning appears under Security issues. Either can cause a sharp, site-wide fall.
Fix the issue, then request a review from the same report. Google’s Manual actions report help explains each type and what a reconsideration request needs.
Did something technical break?
Technical faults usually show as impressions for specific pages falling to near zero, often from a precise date. Check these:
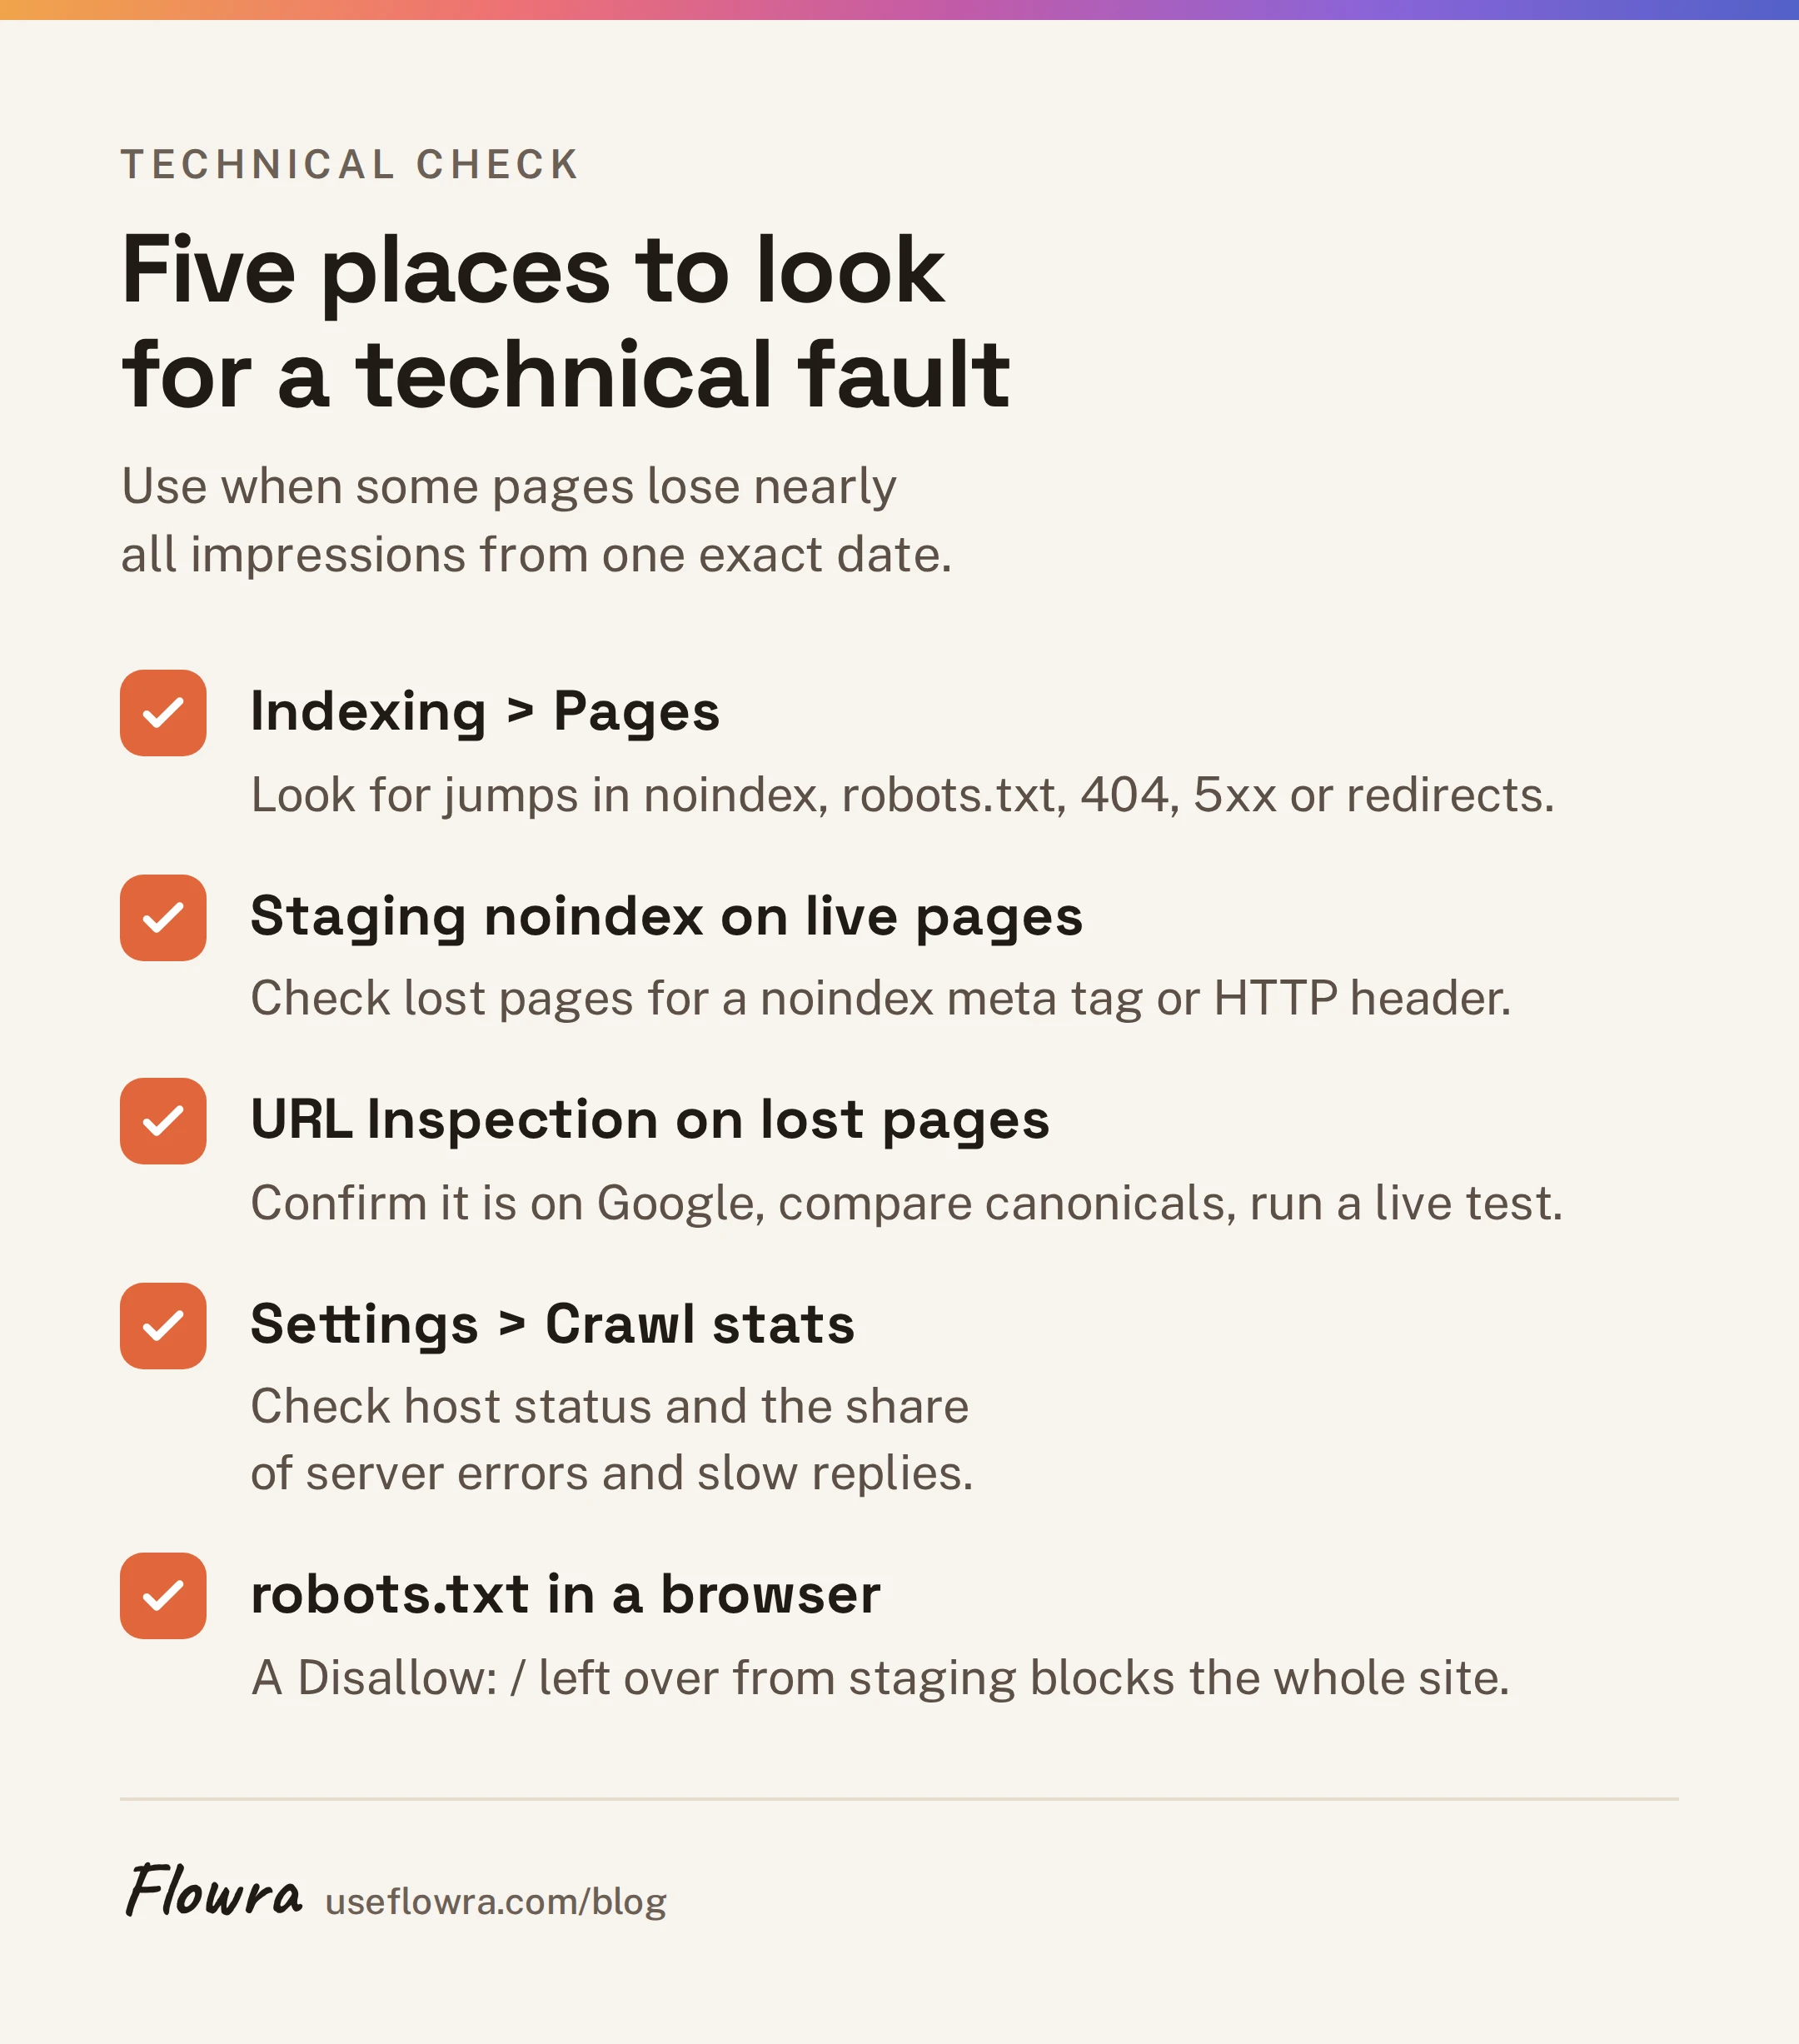
- Indexing > Pages. Look for a jump in “Excluded by ‘noindex’ tag”, “Blocked by robots.txt”, “Not found (404)”, “Server error (5xx)” or “Page with redirect”. A staging noindex pushed to the live site is a classic. Google’s guide to blocking indexing with noindex shows the meta tag and HTTP header to look for.
- URL Inspection on two or three lost pages. Check that the URL is on Google, compare the user-declared and Google-selected canonical, and run a live test.
- Settings > Crawl stats. Look at host status and the share of server errors and slow responses. A hosting problem or an aggressive firewall can stop Googlebot without users noticing anything.
- robots.txt. Open it in a browser and read it. A
Disallow: /left over from staging blocks everything. - Experience > Core Web Vitals. Worth fixing, but slow pages rarely explain a sudden large drop on their own. Look elsewhere first.
Did a redesign or migration change your URLs?
If the drop started the day a new site, CMS or URL structure went live, assume redirects are the problem until proven otherwise. Export the top pages from Search Console for the three months before launch. Each old URL should return a single 301 to the closest new page, not a 404, a redirect chain or a redirect to the home page.
Then check that internal links, canonical tags and the XML sitemap all use the new URLs. Google’s documentation on site moves with URL changes lists the full set of steps.
Did you lose backlinks?
Lost links usually show as a gradual slide on the pages they pointed at, not a cliff. The Links report in Search Console lists your top linking sites and top linked pages. Compare it with an older export if you saved one.
Search Console doesn’t keep a history of lost links, so if you need dates, you’ll need a backlink tool. Recover what you can: contact sites that removed a link, and redirect any deleted page that still has links pointing at it.
Are competitors stronger, or has search intent shifted?
Search your main lost queries yourself, signed out, in the country that matters. Ask two questions. Who now ranks above you, and what do their pages do better? Has the type of page changed, for example from guides to product pages, tools or forum threads?
If the type of page changed, the intent shifted, and rewriting your guide won’t win it back. You need the kind of page Google now prefers, or a different query to target. If the same kind of page beat you, it’s a race on quality and freshness.
A slow slide across older posts, with no date and no obvious competitor, is content decay: pages going stale as the topic moves on. The fix is updating them, starting with the pages that lost the most clicks.
Path B: rankings held but clicks fell
If position and impressions are steady but CTR fell, you still show up in the same place. Fewer people click. The results page around you changed.
Common causes: an AI Overview now answers the query, a featured snippet or People Also Ask box sits above you, more ads appear, or a video, image or forum block pushes your result further down the page.
How to tell if an AI Overview is causing the decline
At the time of writing, Search Console doesn’t report AI Overviews separately. Their impressions and clicks are counted inside the normal web search results. So check by hand:
- Filter Search Console to the pages that lost clicks, open the Queries tab and sort by impressions.
- Search the top 10 to 20 queries signed out, in the country that matters.
- Note which show an AI Overview and whether your page is cited in it.
- Compare the CTR change for queries with an overview against queries without one, over the same dates.
If the CTR drop is concentrated in queries that show an overview, you’ve found your cause. Informational “what is” and “how to” queries are the most exposed.
For a sense of scale, use a study with a clear method. Pew Research Center analysed 68,879 searches by 900 US adults in March 2025. Users clicked a traditional result in 8% of visits when an AI summary appeared, against 15% when none did. Links inside the summary were clicked in 1% of visits, and 18% of the searches showed a summary. Other figures circulate widely, but many are second-hand or measure different things, so check the method before you repeat one to a client.
What you can do about it
- Rewrite titles and meta descriptions for the queries where CTR fell. Promise something a summary can’t give: a template, a calculator, a full worked example.
- Answer the question clearly near the top of the page, so it is a fair candidate to be cited in the overview.
- Shift effort toward queries where people need to click through: comparisons, tools, step-by-step tasks.
- Track visits from AI assistants such as ChatGPT and Perplexity in GA4 by referrer. Then you see traffic that moved, not only traffic that vanished.
How to run a traffic loss audit in one sitting
A traffic loss audit is the steps above done once and written down. With a spreadsheet:
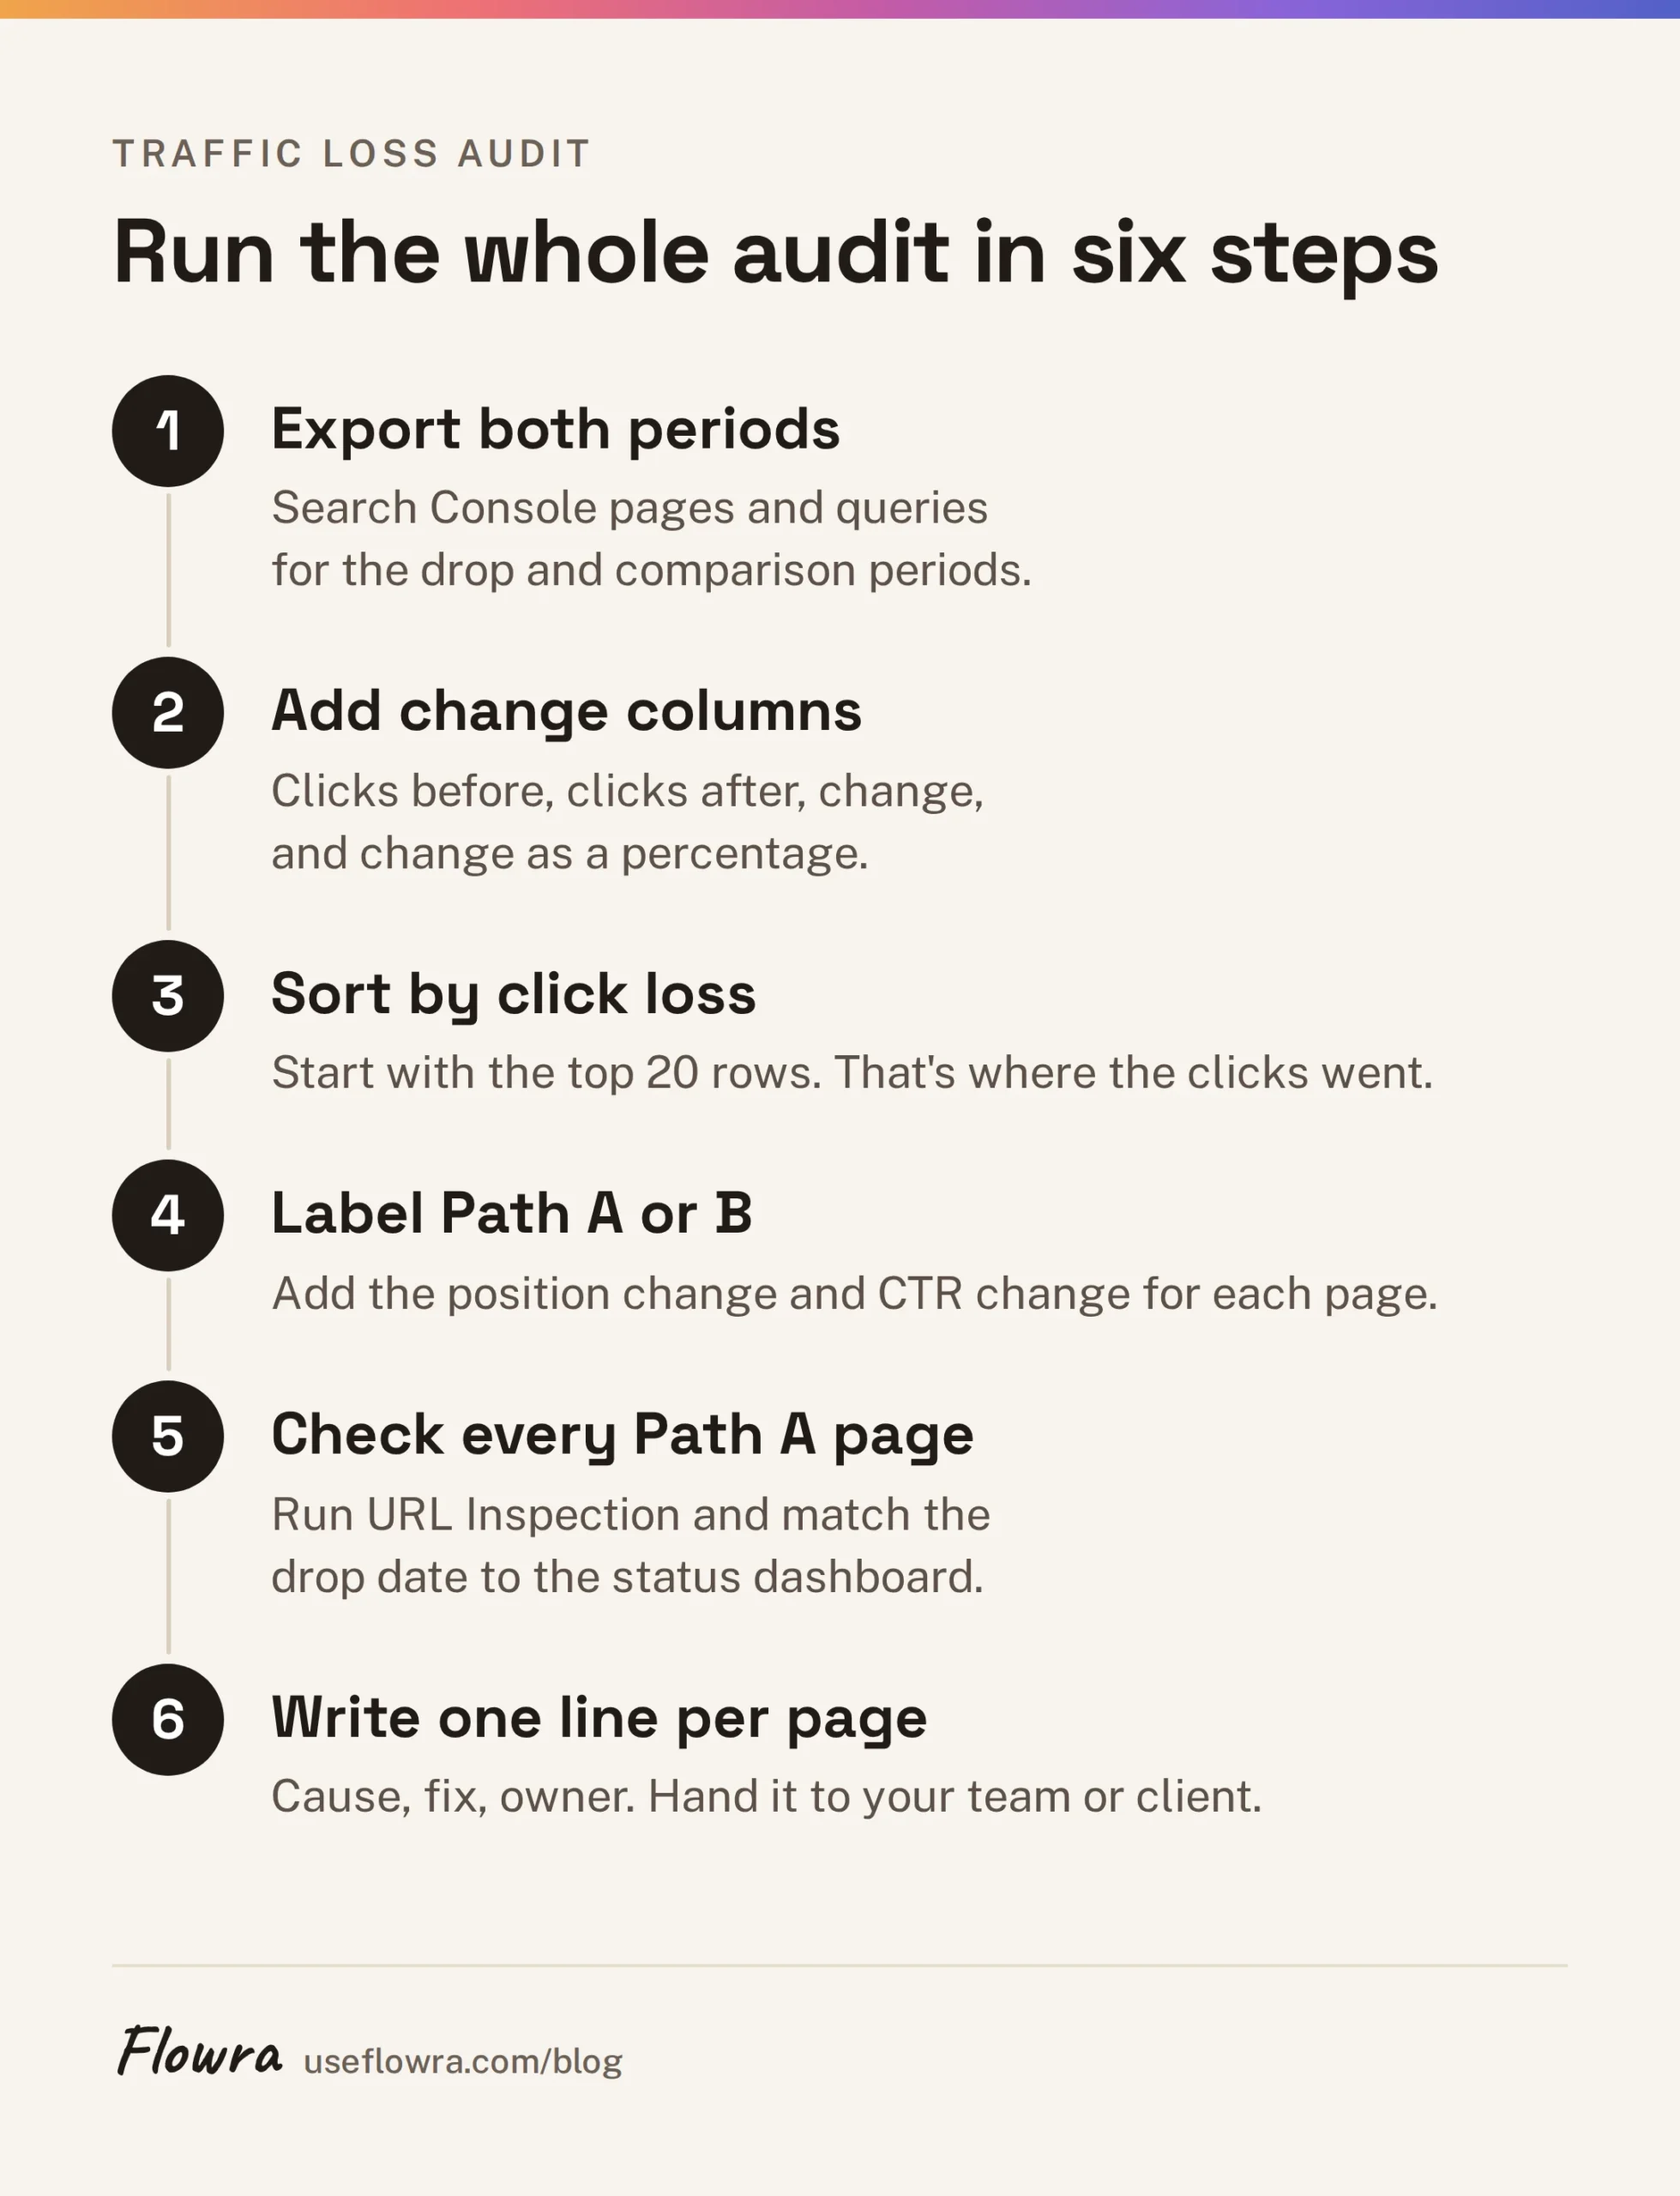
- Export Search Console pages and queries for the drop period and the comparison period.
- Add columns for clicks before, clicks after, change, and change as a percentage:
(after - before) / before. - Sort by absolute click loss and start with the top 20 rows. That’s where the clicks went.
- For each page, add the position change and CTR change, and label it Path A or Path B.
- Run URL Inspection on every Path A page and check the drop date against the status dashboard.
- Write one line per page: cause, fix, owner.
The last column is what you hand to your team or explain to a client. Repeat the export monthly, so the next drop is caught while it’s still small.
Skip the spreadsheet: connect Search Console instead
The manual audit works, but the exports, formulas and before-and-after columns are the same every time. If you’d rather not rebuild them each month, Flowra connects to your Search Console and finds the pages losing traffic for you. There is a Free plan.
On Free, the content decay report lists pages whose clicks and impressions are falling and puts them in a queue to fix. You also get the top 5 striking distance queries, where a page ranks roughly positions 8 to 20. Starter ($49 a month) adds the full Search Console and GA4 analytics dashboard, with 16 months of history and views by query, page, country and device. That puts the click, impression, position and CTR comparisons from steps 1, 3 and 4 in one dashboard, alongside GA4. Pro adds the Index Coverage Monitor, which checks whether pages are indexed and records when that changes (WordPress sites only), and keyword cannibalization reports.
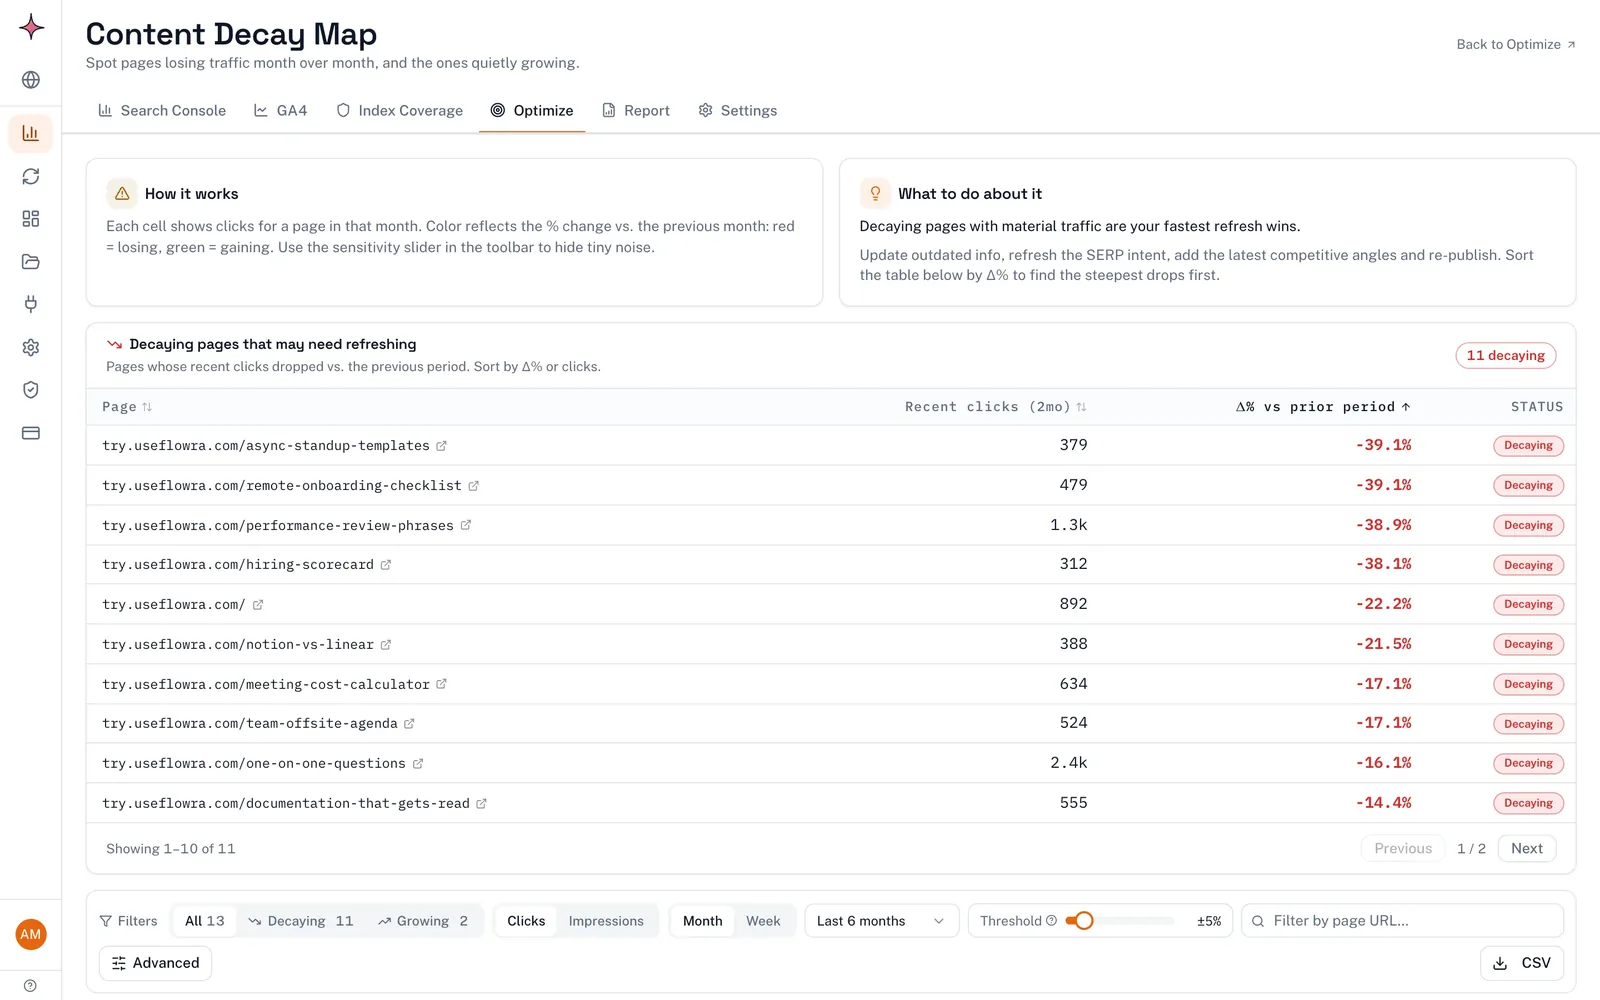
It has limits worth knowing. Positions come from Search Console, and there is no backlink data or site crawler, so the backlink check and the redirect check above stay manual. Once you’ve fixed a page, you can tag the change and get a comparison of the period before and after, with a 14 day settling window and an adjustment for the whole site’s movement. It’s a before-and-after comparison, not a split test.
Start on the Free plan and connect Search Console, then work through the pages that lost the most clicks first.
Frequently asked questions
Why did my organic traffic drop suddenly?
A sudden drop from a specific date usually has one of four causes: a tracking change such as a missing GA4 tag or new consent banner, a technical fault such as a noindex, robots.txt block or missing redirects, a manual action, or a Google update. Compare GA4 with Search Console first. Then check Indexing > Pages, Security & Manual Actions, and the Google Search Status Dashboard for an update on the same date.
Can traffic drop even if my rankings didn’t change?
Yes. If average position and impressions hold but CTR falls, the results page around you changed: an AI Overview, featured snippet, more ads or other features now take the clicks. Impressions can also fall while rankings hold when fewer people search, which points to seasonality or changing interest.
How do I know if an AI Overview is causing my traffic decline?
Search Console doesn’t separate AI Overview data, so check by hand. Take the queries that lost clicks, search them signed out in your target country and note which show an overview. If the CTR drop is concentrated in those queries while your position held, the overview is the likely cause.
Is it seasonality or a real drop?
Set Search Console Performance to the last 16 months and look for the same dip at the same time last year. Then compare the last 3 months with the same months a year earlier. If impressions fell while average position held, and the curve matches last year’s shape, it’s seasonal demand rather than a ranking problem.
How long does it take to recover from an organic traffic drop?
It depends on the cause. Tracking fixes show as soon as the tag works again, and technical fixes such as removing a noindex or restoring redirects recover as Google recrawls the pages. Drops after a core update are slower, and improvements may not show until Google reassesses the site, sometimes at a later update. Clicks lost to SERP changes may not fully return, because the clicks went elsewhere.
Why does Google Search Console disagree with GA4?
They measure different things. Search Console counts clicks on Google Search results, while GA4 counts sessions from all search engines, but only when its tag loads and the visitor accepts tracking. A steady gap between them is normal. A gap that suddenly widens points to a tracking problem rather than an SEO one.