A good SEO report sample shows you two things: what a finished report looks like, and why each section is in it. Below is a free 9-page PDF of a monthly SEO report. You don’t need to sign up to get it. Further down this page there’s also a worked SEO audit report example, written out in the article itself. It’s not a second file.
The short answer: a good SEO report starts with a one-page summary in plain words. After that comes a scorecard, then the pages and searches that moved and why, then technical health, then the work done and the plan for next month. Business results such as leads, sales and sign-ups go at the top, not on page seven.
Download the SEO report sample (PDF, 9 pages, no sign-up)
Here is what the file is. It’s a monthly performance report for September 2026 with a technical health section, not a full audit. It covers a made-up site, northwind-teams.example, prepared by “Your Agency”. Every page is marked “Sample report, invented data”. Copy the structure, but don’t treat the numbers as a benchmark.
The Summary page carries these figures (all invented):
| On the Summary page | Sample value |
|---|---|
| Organic clicks | 12,480, up 9% on August and 31% on September 2025 |
| Demo requests from organic search | 64 |
| Average position | 12.8, improved from 14.2 |
| What happened | Three points |
| Next month | Three points |
SEO audit report vs SEO performance report
Most pages that rank for “seo report example” treat these as one document. They are two documents, and they answer different questions.
| SEO audit report | SEO performance (monthly) report | |
|---|---|---|
| The question it answers | What is wrong with the site, and what should be fixed first? | What changed this period, why, and what happens next? |
| When you write it | At the start of an engagement, then yearly or after big changes | Every month (some teams also check weekly) |
| Main content | Findings, each with evidence, impact and a fix | Trends, wins and drops with reasons, work done |
| Data sources | A crawl of the site, Search Console, page speed tests, link data | Search Console, GA4, your own work log |
| Length | Long, built around a prioritised issue list | Short: a summary page plus supporting pages |
| Main reader | The client, plus the developer or writer who makes the fixes | The client or manager who approves the budget |
| What success looks like | Issues fixed | Numbers moving toward the business goal |
The two connect. The audit produces the list of fixes. The monthly report tracks whether those fixes worked, and it keeps a short technical health check so new problems show up early.
The sample PDF covers the monthly side. The audit example further down covers the other side. If you report to clients every month, our guide to seo reports for clients goes deeper on agreeing what to measure, setting expectations and handling questions.
What is in the free SEO report sample PDF
The file is a 9-page A4 PDF. Each numbered section opens with a “What this section is for” box, so you see the reason for a section before its content.
- Cover with contents.
- Summary. Headline numbers, what happened in three points, and next month in three points.
- Scorecard. Seven metrics for this month, last month and the same month last year.
- Clicks over 13 months. A chart with changes marked.
- Pages that moved. Gainers and losers, each with a reason.
- Searches that moved. Queries that reached page one, and striking distance queries in positions 11 to 20.
- Technical health. Indexing, Core Web Vitals, manual actions, security issues, sitemaps, and why pages are not indexed.
- Work done and next month. Dated work, the plan, and decisions needed from the client.
- What each number means. A glossary.
The sample is a PDF only. There’s no Google Docs or editable version. To use the format for your own clients, rebuild the layout in your own document or slide tool with your real data.
Each section of the sample report, and why it exists
Open the SEO report sample PDF next to this page and follow along. The reason behind each section matters more than how it looks, because the reason lets you adapt the section to any client.
Cover and contents
What the page shows: the cover and a contents list.
The contents list lets a busy reader jump to the page they care about. On your own cover, name the site, the period and who prepared it. A report without a clear period on the cover gets mixed up with last month’s, especially once it has been forwarded twice inside the client’s company.
1. Summary: the only page some readers will see
What the page shows (invented data): the figures in the table at the top of this article, then what happened in three points and next month in three points.
Note the wording on average position. A lower number is better. A client who sees 14.2 become 12.8 may read it as a fall, so write “improved”.
The three-point limit is deliberate. If you can’t explain the month in three sentences, the reader won’t be able to either. Each point should name a cause, not repeat a number from the scorecard. An example (not from the file):
- Weak: “Clicks increased 9% month over month.”
- Strong: “Clicks rose 9%, mostly from the two guides we updated on 8 September, which moved from page two to page one.”
2. Scorecard: the same metrics, every month
What the page shows: a table of seven metrics, each for this month, last month and the same month last year.
| Metric | Where it comes from | Why it earns a place |
|---|---|---|
| Clicks | Search Console | Visits from Google search |
| Impressions | Search Console | Demand and visibility, read together with clicks |
| CTR | Search Console | Whether titles and snippets win the click |
| Average position | Search Console | Direction of rankings (lower is better) |
| Organic sessions | GA4 | Visits as your analytics counts them |
| Demo requests (key event) | GA4 | The business result |
| Pages with a click | Search Console | How widely traffic is spread across the site |
Keep the same metrics in the same order every month. If you change them, say so. Otherwise the client will assume you dropped a number because it looked bad.
The same-month-last-year column is there because of seasonality. A B2B site often dips in August and recovers in September, so comparing only with last month would make every September look like a win.
“Pages with a click” shows breadth. If clicks rise while fewer pages get any, growth depends on a handful of pages, and one ranking loss could undo the month.
3. Clicks over 13 months
What the page shows: a chart of clicks over 13 months, with changes marked.
Thirteen months puts the same month last year on the same chart as this month. The markers are the point. With them, the reader can see whether a rise or a drop lines up with something that happened, and your claims become something they can check. On your own chart, mark anything that could explain a change in the line, such as a migration, a batch of rewrites or a confirmed Google update.
4. Pages that moved
What the page shows: the gainers and losers, each with a reason.
If you list a drop without a reason, the client has to guess, and clients tend to guess the worst. Reasons that hold up in your own report:
- The page lost a ranking to a competitor’s newer page for its main query.
- Seasonal demand, checked against the same month last year.
- Two of your own pages now compete for the same query (keyword cannibalization).
- The page was changed, moved or redirected.
- A tracking change, such as a GA4 filter or consent banner, rather than a real traffic change.
“We don’t know yet, and here is how we’ll find out” is an acceptable reason. An invented explanation is not.
5. Searches that moved
What the page shows: queries that reached page one, and striking distance queries in positions 11 to 20.
Striking distance queries are searches where a page sits close to page one, so a focused update could move it up. This section turns the report from a look back into a to-do list, and next month’s plan usually starts here. To build it yourself:
- Open Search Console > Performance > Search results.
- Set the date range to compare this month with last month.
- Open the Queries tab and export it.
- In the spreadsheet, filter by position: under 10 this month but over 10 last month for “reached page one”, and 11 to 20 for striking distance.
6. Technical health
What the page shows: indexing, Core Web Vitals, manual actions, security issues and sitemaps, plus why pages are not indexed.
Each check is a Search Console report:
| Check | Where to find it in Search Console | What to write in your report |
|---|---|---|
| Indexing | Indexing > Pages | Indexed and not indexed counts, and reasons for important pages that aren’t indexed |
| Core Web Vitals | Experience > Core Web Vitals | Good, needs improvement and poor URL groups, mobile and desktop separately |
| Manual actions | Security & Manual Actions > Manual actions | “None”, or the action and your response |
| Security issues | Security & Manual Actions > Security issues | “None”, or the issue and the fix |
| Sitemaps | Indexing > Sitemaps | Status, last read date, discovered URLs |
For Core Web Vitals, the “good” limits are LCP of 2.5 seconds or less, INP of 200 milliseconds or less and CLS of 0.1 or less, measured at the 75th percentile of page visits with mobile and desktop reported separately, according to web.dev. Always say which device you mean, because a site can pass on desktop and fail on mobile. This is field data from real Chrome users, so low-traffic pages may have no data at all.
The “why pages are not indexed” part matters most, because different reasons need different fixes:
- “Crawled, currently not indexed” usually means a quality or duplication problem.
- “Discovered, currently not indexed” usually means a crawl or internal linking problem.
- A page excluded with noindex on purpose needs no fix.
Many “not indexed” pages are fine, such as redirects, duplicates with a correct canonical and filtered URLs. Saying so stops the client panicking at a big number.
7. Work done and next month
What the page shows: dated work, the plan, and decisions needed from the client.
- Dated work is what you did and when. The dates tie your work to the markers on the 13-month chart.
- The plan is what you’ll do next month.
- Decisions needed from the client are the things you can’t do without them.
Most reports leave out the decisions list, and it saves the most time. Putting a request in writing, such as “we need developer time to fix the redirect chain on the pricing pages”, means a delay is visibly not your fault, and approvals come faster.
8. What each number means
What the page shows: a glossary defining each metric in the report.
The person reading the report changes. The marketing manager who knew what CTR meant leaves, and the new one gets the PDF. A glossary page heads off a lot of “what does this mean?” emails.
SEO audit report template and a worked example
The sample’s technical health page is a monthly check, not an audit. A full SEO audit goes deeper and is built around findings. This section is the audit template: the sections to cover, the format for each finding, and a filled-in example you can copy.
| Audit section | What to check | Where to look |
|---|---|---|
| Crawlability and indexing | robots.txt blocks, noindex on pages that should rank, important pages not indexed, sitemaps listing only indexable URLs | Search Console Indexing > Pages and Sitemaps, URL Inspection, a site crawler |
| Canonicals | Each page’s canonical points to itself or the correct version, and Google agrees | URL Inspection (“User-declared canonical” vs “Google-selected canonical”), a crawler |
| Broken links and redirects | Internal links to 404 pages, redirect chains, links to redirected URLs | A site crawler |
| Core Web Vitals | LCP, INP and CLS by page template, mobile and desktop separately | Search Console Experience > Core Web Vitals, PageSpeed Insights |
| On-page | Missing or duplicate titles and meta descriptions, heading structure, thin pages | A crawler, then a manual review of key pages |
| Content | Pages losing clicks, two pages competing for one query, pages with no clicks in 12 months | Search Console Performance (pages and queries, compare periods) |
| Backlinks | Referring sites, links pointing at 404 pages, sudden changes | Search Console Links report, a backlink tool |
How to write each audit finding
Without a fixed format, an audit becomes a 60-page list nobody acts on. Give every finding six fields:

- Issue: what is wrong, in one sentence.
- Evidence: the report, URL or export that shows it.
- Impact: which pages it affects, and why that matters.
- Fix: the specific change, written for the person making it.
- Owner: developer, writer or client.
- Priority: high, medium or low, based on impact and effort.
Put a one-page summary first, then the prioritised list, with detail at the back. The client reads the front, and the developer works from the back.
SEO audit report example (invented data)
This example is written for this article and is not in the PDF. It uses the same made-up site, northwind-teams.example, and every number is invented.
Audit summary. northwind-teams.example is crawlable, its sitemap is read without errors, and it has no manual actions or security issues. The main risks sit on the pages closest to revenue: nine pricing and feature pages are not indexed, and 14 blog posts point their canonical at the blog home page, so neither group can rank in its own right. Fix the two high-priority items first. They need about two days of developer time and one writer’s merge plan. The five medium and low items can follow over the next two months.
| Priority | Issue | Evidence | Impact | Fix | Owner |
|---|---|---|---|---|---|
| High | 9 pricing and feature pages are “Crawled, currently not indexed” | Indexing > Pages reason list; URL Inspection on each URL | These pages target the searches closest to demo requests and can’t rank | Merge the near-duplicate feature pages into 3 stronger ones; link to them from the top guides | Writer, developer |
| High | 14 blog posts declare /blog/ as their canonical | URL Inspection: user-declared and Google-selected canonical are both /blog/ | The posts are unlikely to rank for their own queries | Output a self-referencing canonical in the post template | Developer |
| Medium | /pricing redirects to /plans, which redirects to /plans/ | Crawler redirect chain export; the main menu links to /pricing | An extra hop on every visit and crawl of a key page | Point the menu link and the first redirect straight at /plans/ | Developer |
| Medium | Blog post template has poor LCP on mobile (3.4 s), good on desktop | Experience > Core Web Vitals, mobile report, “poor” URL group | Every post in that group fails the 2.5 s “good” limit on mobile | Compress and preload the header image; lazy-load images below the fold | Developer |
| Medium | 22 pages share the title “Northwind Teams Blog” | Crawler page title export | Weak snippets in results; Google may rewrite the titles | Build titles from each post’s own heading in the template | Developer, writer |
| Medium | “team standup template” splits between two pages | Performance > Queries, filter the query, Pages tab lists two URLs at positions 9 to 14 | Neither page holds page one | Merge into the stronger page and 301 redirect the other | Writer |
| Low | 31 internal links point to 6 deleted URLs (404) | Crawler broken internal links export | Wasted clicks for readers; small crawl cost | Update the links to live pages or redirect the old URLs | Writer |
Look at what the summary does. It says what is fine, names the two biggest risks in plain words, and says what the fixes cost. A client who reads only that paragraph still knows what to approve. Once the fixes ship, tag their dates in your monthly report so the 13-month chart shows whether they worked.
What tools are used for an SEO audit
You can do most of an audit with free tools:
- Google Search Console for indexing, canonicals (through URL Inspection), Core Web Vitals, manual actions, security issues, sitemaps, queries, pages and links.
- GA4 for organic sessions and key events.
- PageSpeed Insights for page-level speed data.
Two paid tools are common: a desktop site crawler for broken links, redirects and on-page checks, and a backlink tool if links are part of the work. A spreadsheet holds it together.
The sample PDF has no backlinks section, because a content-led monthly report rarely needs one. If link building is part of your work, add a section listing the new referring sites you earned and the pages they point to.
Types of SEO report, and when to send each
| Report type | What it covers | When to send it |
|---|---|---|
| Monthly overview | Summary, scorecard, what moved, work done, next steps (the sample PDF) | Every month |
| Technical audit | Crawlability, indexing, canonicals, redirects, speed, structured data | At the start, after a migration or redesign, then yearly |
| Rankings report | Positions for agreed queries over time | Inside the monthly report, rarely alone |
| Backlink report | New and lost referring sites, links to broken pages | Monthly or quarterly, if you build links |
| Content report | Pages gaining and losing clicks, pages to update, merge or remove | Monthly or quarterly |
| Competitor report | Who outranks the client for key queries, and why | Quarterly, or when planning |
| Executive summary | One page: business results, trend, main risk, the ask | Monthly, as the overview’s first page |
Most clients need an audit at the start, then one monthly overview with a strong summary page. Separate rankings and backlink reports usually repeat what the overview already says.
SEO report format: write for the person who reads it
The person who approves the budget wants three answers. Is it working? Is anything wrong? What do you need from me? Everything else supports those answers.
Put high-level numbers first
Order the report from general to detailed: summary, scorecard, trend, pages and queries, then technical detail. A reader who stops after page two should still know how the month went.
Send a PDF as the monthly record. It’s fixed and dated, and anyone can open a forwarded copy without a login. A live dashboard suits your own daily checks but makes a poor record, because the numbers shift and nobody can say what they showed last month.
Tie results to revenue and business goals
Clicks are a means, not the goal. That’s why the sample puts demo requests from organic search (a GA4 key event) in both the summary and the scorecard.
Pick the one or two key events that match the client’s goal, such as demo requests, sign-ups, purchases or calls, and report them every month. If you can’t link organic traffic to any key event, say so, and put setting one up under “decisions needed from the client”.
Be careful with attribution. GA4 credits conversions using its own model, and organic search often helps a sale that another channel gets credit for. Report the number GA4 gives you, name the attribution setting once in your glossary, and don’t inflate it.
Leave out vanity metrics
A metric belongs in the report only if a change in it would change what you or the client do next. These usually fail that test:
- Total keywords ranking (mostly page-five queries nobody clicks).
- Domain authority scores from third-party tools.
- Raw impressions, reported without clicks or CTR.
- A count of issues found, with no priority attached.
If a client asks for one, add it to the scorecard with a glossary line on what it does and doesn’t tell them. Don’t make it a headline.
How to present a bad month honestly
How you report bad months decides whether the client trusts your good ones.
- Say it in the summary. “Clicks fell 12% this month” goes in the first point, not on page six.
- Size it. Compare with last month and the same month last year. A fall against August that is still up on last year is a different story.
- Find where it came from. It’s usually a few pages or queries. List them in “Pages that moved” with a reason for each.
- Separate the causes. Some are yours (a page you changed), some are the client’s (a site release) and some are nobody’s (seasonality, a Google update).
- Give your response. Say what you’re doing, by when, and what you need from the client.
Don’t bury a drop in a long table, change the date range to hide it, or swap the headline metric. Clients notice, and then your next good month reads as spin.
Reporting AI Overview and AI assistant visibility
Clients now ask how they appear in AI answers. Be precise about what you can measure.
As of October 2026, Google’s documentation on AI features and your website says sites shown in AI Overviews and AI Mode are counted in the Search Console Performance report under the “Web” search type, with no separate AI line. So Search Console can’t give you AI Overview visibility as its own number. If a page’s clicks fall while its impressions hold, a change on the results page is one possible reason. Present it as a likely cause, not a measured one.
For assistants such as ChatGPT and Perplexity, GA4 records the visits they send as referral traffic. Go to Reports > Acquisition > Traffic acquisition and filter by session source. This only counts visits that arrive, not answers that mentioned the client without a click, so call it the lowest possible figure. One scorecard line is enough.
AI can also draft the summary from your numbers. Check every figure it uses, and never let it invent a reason for a drop. Every “why” should trace back to data or a dated piece of work.
Automating SEO reports and choosing a schedule
Monthly reporting suits most clients: long enough to show a trend and for changes to appear in Search Console. Weekly checks suit the person doing the work, because a drop gets caught in week one instead of at month end. Quarterly suits audits, competitor reviews and content reviews.
Automate the parts that are pure data: the scorecard, the chart, and the top pages and queries. The summary, the reasons and the decisions list still need a person who knows the account.
The quickest free way to build the data pages is our search console report generator. It runs in your browser and turns the Performance export (the CSV zip) into a branded PDF with site totals and change against the previous period, clicks per day, top queries, top pages, devices, countries and a drafted summary you should edit before sending.
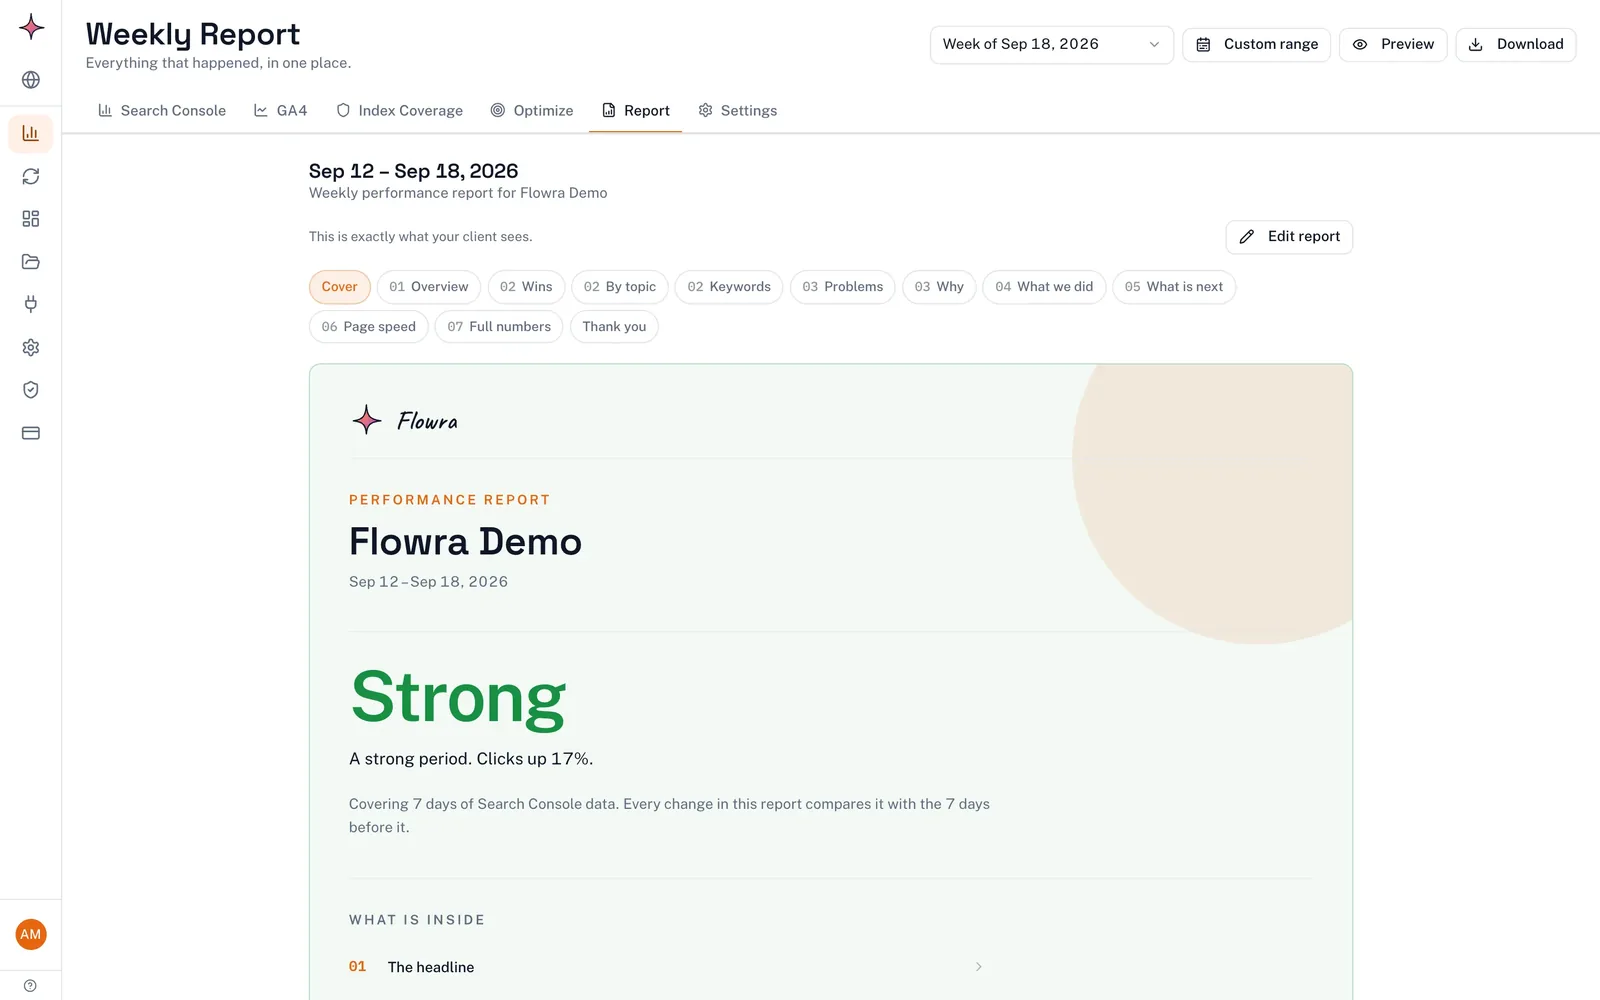
If you want the weekly check done for you, Flowra builds a report for each site from its Search Console and GA4 data and rebuilds it every week. It explains what moved and why in plain language, written by fixed rules rather than AI, and you can add your own lines about the work you did. You share it as a link that always shows the latest week, with your agency’s name, logo and colour on Starter and above. On Starter and Pro a small “Report made with Flowra” line stays at the bottom; the Agency plan removes it. Nothing is emailed to the client, and it doesn’t cover manual actions, security issues, backlinks or indexing status, so check those by hand. If you report monthly, use the weekly report to catch problems early and send your monthly report as usual.
What to do next
- Download the SEO report sample and note which sections your current report lacks. The usual gaps are the reasons in “Pages that moved” and the decisions list.
- Agree one or two GA4 key events with your client and put them in next month’s summary.
- Rebuild the layout in your own document tool, keeping “What this section is for” as a one-line note under each heading.
- If the site hasn’t been audited in the last year, run a full audit and write it up like the example above: one summary paragraph, then findings with all six fields.
- Write next month’s summary as three “what happened” points, each naming a cause.
If you’d rather not rebuild the data pages yourself, Flowra’s white label SEO report does this automatically every week for the whole site.
Frequently asked questions
What is an SEO report?
An SEO report shows how a site performed in organic search over a period, why it changed and what happens next. A performance report covers clicks, rankings, conversions, the work done and the plan. An audit report lists what is wrong with the site and what to fix first, with evidence for each issue.
What format should an SEO report take?
Send a PDF as the monthly record, because it is fixed, dated and easy to forward without a login. Start with a one-page summary that leads with business results. Follow it with a scorecard, the pages and searches that moved with their reasons, technical health, and the work done and next steps.
How often should an SEO audit be done?
Run a full SEO audit at the start of an engagement, then about once a year. Run another after any migration, redesign, CMS change or large unexplained traffic drop. Between audits, a short monthly technical health check in Search Console catches new problems early.
What’s the difference between a technical audit and a full SEO audit?
A technical audit covers how search engines crawl, index and load the site: robots.txt, indexing, canonicals, redirects, broken links and Core Web Vitals. A full SEO audit adds on-page checks, content (pages losing traffic, pages competing for one query, gaps) and backlinks. After a sudden traffic drop, start with the technical audit, because a technical fault can make content work pointless.
How long does it take to see results after fixing issues?
It depends on the fix and on how often Google recrawls the pages, and Search Console data runs a couple of days behind. Technical fixes on important pages can show within a few weeks of recrawling, while content and link work usually takes longer. Wait at least one full reporting period, and compare with the same period last year to rule out seasonality.
Can I use this format for my own clients?
Yes, copy the structure of the sample PDF and the audit example freely for your own client reports. The sample is a PDF only, with no editable version, so rebuild the layout in your own document or slide tool. Every number in both is invented for a made-up site, so replace them with your client’s real data.