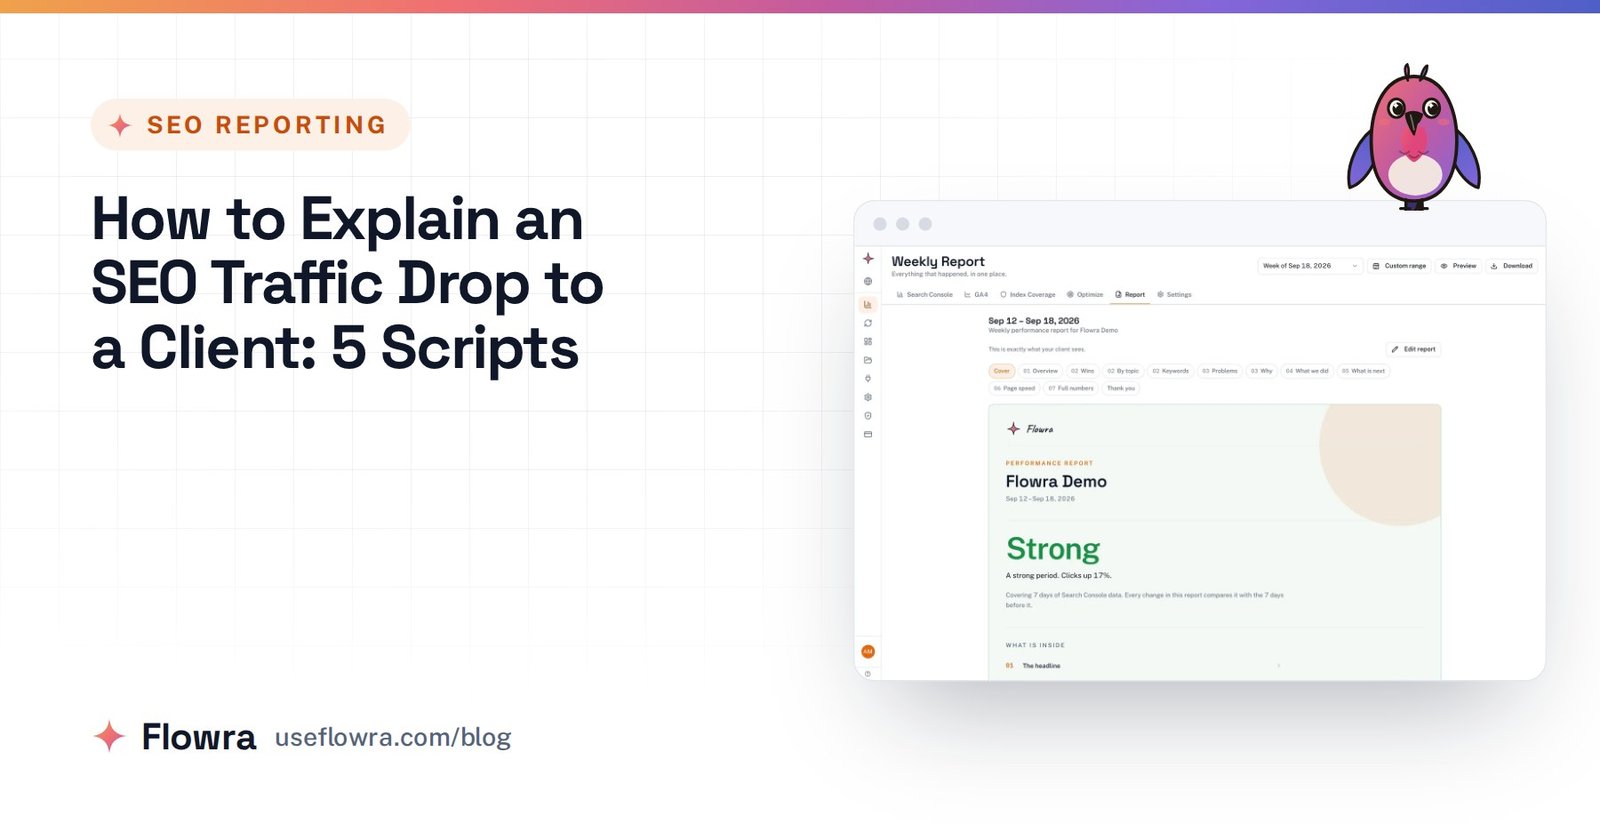
A website SEO report is a short summary of how a site is doing in organic search. It covers clicks and impressions from Google Search Console, organic sessions and conversions from GA4, the pages and queries that moved, anything broken, and what happens next. An SEO report dashboard holds the same numbers live, so you can check them any day instead of waiting for the monthly PDF.
The useful version fits on one page. It opens with a one-sentence verdict, shows four headline numbers against a fair comparison, and leaves most metrics out. Below you’ll find the layout, a filled-in example and the manual build with free Google tools.
If you report to clients, read our guide to SEO reports for clients alongside this one. This page focuses on the layout itself.
SEO report vs SEO dashboard: what’s the difference?
People use the two words loosely, but they do different jobs.
| SEO dashboard | SEO report | |
|---|---|---|
| Data | Live, refreshes on its own | A fixed period, such as last month |
| Who uses it | The people doing the work | Clients, managers, executives |
| Main job | Spot problems early, explore detail | Explain what happened and what’s next |
| Commentary | None, you read it yourself | A written verdict and recommendations |
| Format | Charts, filters, date pickers | One page, a PDF or a shared link |
Most teams need both. Use the dashboard for watching and the report for telling. A dashboard sent to a stakeholder with no commentary usually gets misread.
Audit dashboards and KPI dashboards
There are two kinds of SEO dashboard, and mixing them is the most common reason a report runs to ten pages.
- Audit or technical dashboards show crawl errors, pages not indexed, Core Web Vitals, broken links and redirect chains. They are for whoever fixes the site.
- KPI or outcome dashboards show clicks, organic conversions, leads and revenue. They are for whoever pays for SEO.
The one-page report is a KPI document. Technical health gets one line (“no new indexing problems”) unless something is broken badly enough to affect the numbers.
Why use an SEO report at all?
There are three reasons, and each one asks for different data.
- Track performance. You want to see a drop within a week or a month, not a quarter later.
- Show return. Tie organic sessions to conversions in GA4, so the budget conversation is about leads and sales rather than rankings.
- Compare with competitors. Search Console only shows your own site. Competitor visibility needs a third-party tool such as Semrush, Ahrefs or Moz, and belongs in a quarterly review, not every month.
What to include in a website SEO report
These are the components most guides list. The useful question is which of them earn a place on the one page.
| Component | What it answers | Where the data comes from | On the one page? |
|---|---|---|---|
| Organic traffic | Are more people arriving from search? | Search Console clicks, GA4 organic sessions | Yes, as a headline |
| Keyword performance and rankings | Which searches gained or lost? | Search Console queries, or a rank tracker | Yes, top movers only |
| Conversions and engagement | Does search traffic do anything? | GA4 key events and engagement rate, filtered to Organic Search | Yes, as a headline |
| Page performance (on-page) | Which pages are rising or decaying? | Search Console pages | Yes, top movers only |
| Technical health | Can Google crawl and index the site? | Search Console indexing and Core Web Vitals reports | One line, unless broken |
| Backlinks | Is the site earning links? | Semrush, Ahrefs, Moz, or the Search Console Links report | Quarterly |
| Local SEO | How the map listing performs | Google Business Profile performance | Local businesses only |
| Referral traffic | Visits from other sites and AI assistants | GA4 Traffic acquisition | Only if it’s a goal |
For the technical line, Google’s Page indexing report and Core Web Vitals report give you what you need without a crawler.
The one-page SEO dashboard layout, top to bottom
Order matters because most readers stop after the first screen. Put the answer first and the evidence under it.
- The verdict. One sentence on what happened and why.
- Four headline numbers. Clicks, impressions, organic conversions and non-branded clicks, each against the same period last year as well as the previous period.
- One trend chart. Monthly clicks over the longest range you have, so this year sits next to last year.
- Wins. Three to five pages or queries that grew, each with the reason if you know it.
- Problems. Pages losing clicks, queries that fell off page one, and any technical issue that affects traffic.
- What we did and what’s next. The work shipped this period, then the plan for the next one, with an owner for each item.
Example: a filled-in one-page report
Example only: the site, pages and figures are invented to show the layout.
Verdict: A good month. Non-branded clicks are up 14% on March last year, mostly from the new pricing guide. Two older how-to posts are slipping and get updated in April.
| Headline number | March 2026 | vs March 2025 | vs February 2026 |
|---|---|---|---|
| Clicks | 18,400 | +11% | +4% |
| Impressions | 612,000 | +19% | +6% |
| Non-branded clicks | 12,900 | +14% | +5% |
| Organic conversions (demo requests) | 142 | +9% | +2% |
Wins
- /pricing-guide reached page one for “project tool pricing”: +1,100 clicks on last year.
- /templates/okr: +640 clicks after the February rewrite.
- “standup meeting agenda” moved from position 12 to 6.
Problems
- /how-to-run-retros: clicks down 31% on last year, and a second page on the site now competes for the same searches.
- Two new posts show as “Discovered, currently not indexed” in Search Console.
Next steps
- Update /how-to-run-retros and merge the competing post (owner: Sam, by 15 April).
- Add internal links to the two unindexed posts and request indexing (owner: Priya, this week).
- Brief a second pricing guide on the same pattern (owner: content lead, by 30 April).
Copy that structure into a Google Doc and you have a template.
What to leave out
- Site-wide average position as a headline. It falls when you start ranking for new long-tail queries, so good news can look like bad news.
- Total number of ranking keywords. Most of them get no clicks.
- Third-party authority scores. They are vendor metrics, not Google’s, and rarely change a decision.
- Bounce rate. GA4 reports engagement rate instead.
- Full tables of every page or query. Link to the dashboard for detail.
- Page speed scores that didn’t change.
The rule: if a number would not change a decision, it goes in the dashboard or an appendix, not on the page.
How to build an SEO report by hand
You can do all of this with free Google tools.
- Gather the data. In Search Console, open Performance > Search results, set the date range, then use the Compare tab to add the same period last year. Export (top right) to get a zip of CSVs with queries, pages, countries, devices and dates. Google’s Performance report documentation explains each metric. For a quick first draft, drop that zip into our free Search Console report generator: it runs in the browser with no sign-up and gives you a branded PDF with totals, change against the previous period, clicks per day, top queries, top pages, devices, countries and a drafted summary. In GA4, open Reports > Acquisition > Traffic acquisition and filter to Session default channel group exactly matches Organic Search.
- Pick three to five KPIs. Tie them to the business goal: leads for a service site, revenue for a shop, signups for software. Agree them once with whoever reads the report.
- Arrange them in the layout above. A Google Doc with a few charts works. For a live dashboard, use the Search Console connector in Looker Studio: choose Site Impression for site totals and URL Impression for page data, then add GA4 as a second data source.
- Analyse. Compare year on year first, then against the previous period. To split brand traffic out, add a Query filter in Search Console for queries not containing your brand name.
- Recommend. Give each problem one action and an owner.
- Summarise. Write the verdict last and put it at the top.
The first report takes the longest because you are agreeing KPIs and building the template. After that, most of the time goes on steps 4 and 6, the part your reader actually values.
How to tell real change from noise
A dashboard shows what happened. It does not tell you why. Before you write the verdict, run these checks.
- Don’t judge on a week. Daily clicks swing with weekdays and holidays. Use at least 28 days.
- Compare year on year. Search Console keeps 16 months of data, so you can set a month against the same month last year. This removes most seasonal false alarms.
- Check whether it’s one page or the whole site. If every page dropped in the same week, look for a Google update, a tracking change or a site-wide fault before you blame the content.
- Separate branded from non-branded. Brand searches follow ads, PR and campaigns, not SEO work.
- Watch averages. Average position and CTR move when the mix of queries changes, even if nothing on the page did.
- Ignore the last few days. Recent data can be incomplete.
- Accept the attribution gaps. Someone who finds you through search and buys later through an email is not credited to organic. An AI answer that never sent a click does not appear at all.
If you look every morning, you will react to normal wobble. When you change a page, give it a few weeks to settle and compare it against the rest of the site, not against yesterday.
How often should you make an SEO report?
| Cadence | What it is | Who it’s for |
|---|---|---|
| Weekly | A glance at the dashboard for drops and indexing problems, no write-up | The SEO team |
| Monthly | The one-page report | Clients, managers |
| Quarterly | Results against goals, competitor comparison, backlinks, next quarter’s plan | Clients, leadership |
| Yearly | Year-on-year results and budget | Leadership |
Should executives see the same dashboard as marketers?
No. Executives need the verdict, conversions or revenue, and the next step. Marketers need the live dashboard with query and page detail. It is the same data at a different depth.
Skip the spreadsheet: connect Search Console instead
The manual method works, but you repeat the export, paste and chart steps every month. If you’d rather not, connect Search Console and GA4 to Flowra. Create a free account and connect Search Console and GA4.
The Free plan includes a content decay report and your top 5 striking distance queries. The full Search Console and GA4 dashboard and branded client links start on Starter at $49 a month.
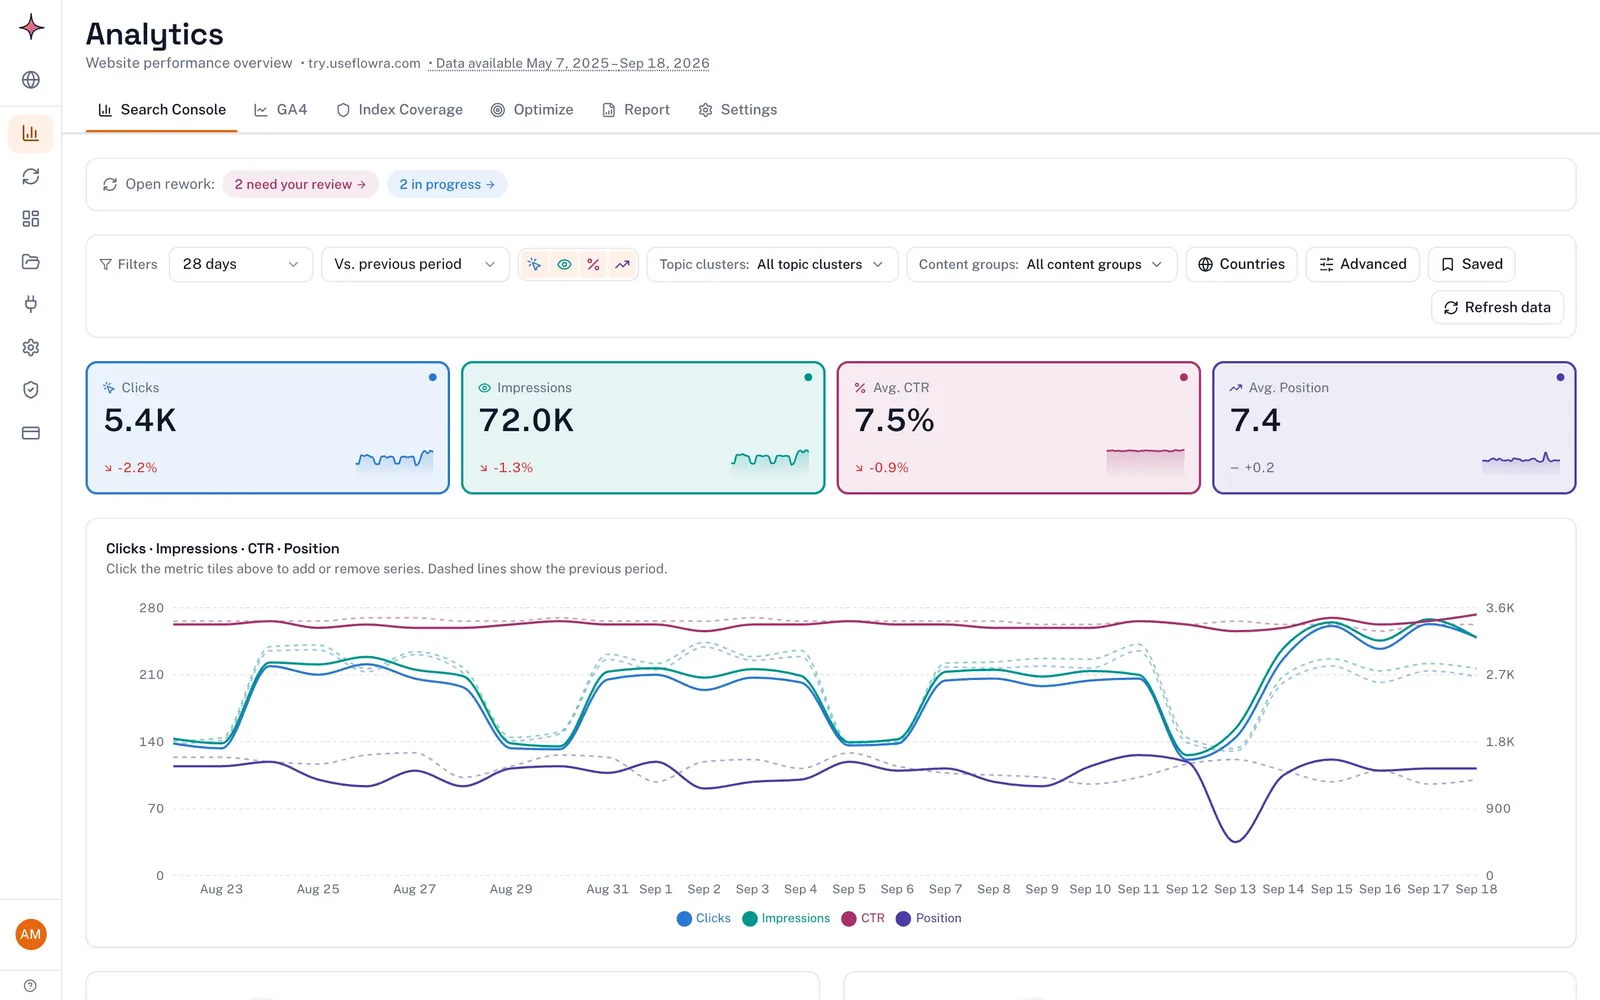
The client report rebuilds every week from the site’s Search Console and GA4 numbers. It explains what moved in plain language, using fixed rules applied to the data rather than AI: wins, keyword gains and drops, pages that reached page one, and a closing summary. You add your own lines about the work you did. If you report monthly, use the weekly version to catch problems early and send your monthly report as usual.
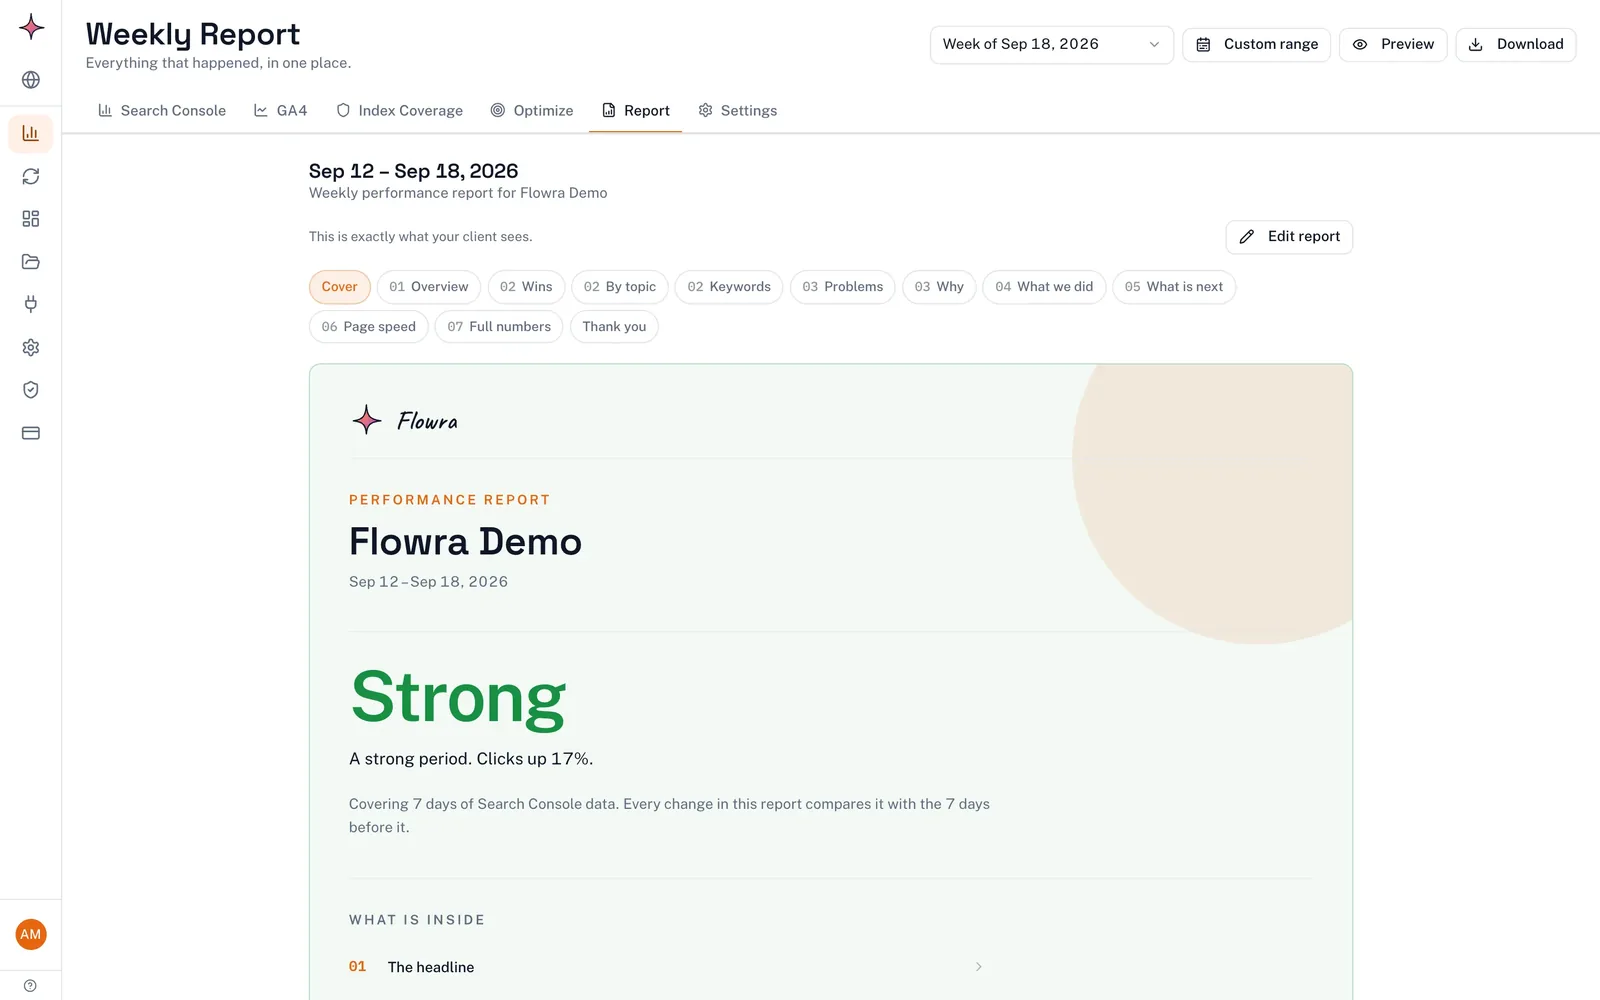
To share it, create a client link that always shows the latest week, with your agency’s name, logo and colour. On Starter and Pro, a small “Report made with Flowra” line stays at the bottom. The Agency plan removes it, giving you a fully white label SEO report.
The report doesn’t cover backlinks, manual actions, security issues or indexing status, so keep those as a quick manual check. Nothing is emailed to clients: you send the link.
What to do this week: pick your three to five KPIs and agree them with whoever reads the report. Then build the first page by hand from the example above, or connect Search Console and let the dashboard fill in.
Frequently asked questions
What are the best tools for creating SEO reports?
Google Search Console and GA4 give you the core data for free, and Looker Studio can combine them into one dashboard at no cost. Add Semrush, Ahrefs or Moz if you need backlink data or competitor rankings. Reporting tools such as Flowra build the report from Search Console and GA4, so you don’t have to maintain a template.
How do I get a free SEO report from Google?
The Search Console Performance report is effectively a free SEO report, showing clicks, impressions, CTR and position by query, page, country and device for up to 16 months. Export it and drop the zip into our free Search Console report generator to get a branded PDF with totals, top queries, top pages, devices and countries. Or connect Search Console to Looker Studio for a live dashboard. GA4 adds what those visitors did once they arrived.
How long does it take to create an SEO report?
The first report takes the longest, because you have to agree KPIs and build a template. After that, collecting the data is quick and most of your time goes on analysis and the written verdict. Automated dashboards remove the data step, but not the thinking.
What makes a good SEO report?
A good SEO report answers “how did we do?” in its first sentence. It shows only a few numbers, each against a fair comparison such as the same period last year. It explains why things moved, not just that they moved, and every problem comes with an action and an owner.
Can I build an SEO dashboard without technical skills?
Yes. Looker Studio’s Search Console and GA4 connectors are point and click and need no code. The hard part isn’t technical: it is deciding which metrics to leave out so the dashboard stays readable.