An SEO report is a summary of the numbers that show how a website performs in search: how many people found it on Google, which searches they used, which pages they landed on, and what they did next. A good one also explains what changed, why it changed, what work was done and what happens next.
The rest of this page covers what goes in a report and walks through a sample, number by number. It also gives you the questions to ask if someone else writes yours.
What is an SEO report, and why does it matter?
An SEO report turns raw data from tools like Google Search Console and Google Analytics 4 (GA4) into a short account of one period, usually a month. Most of the numbers are search metrics such as clicks, impressions, rankings and click-through rate. The useful reports also connect those numbers to business results, like sign-ups, leads or sales.
It matters because SEO is slow and hard to see. A manager or client can see an ad running, but they cannot see a ranking improve. The report is how you show that the work is paying off. If it is not paying off yet, the report shows what you are changing.
A reader should get answers to three questions in under a minute:
- Is organic search growing, flat or falling?
- Why?
- What are we doing about it?
If a report cannot answer those, it is a data dump, however many charts it has.
SEO report vs rank report vs SEO audit
These three often get mixed up, and some providers sell one under the name of another.
| SEO report | Rank report | SEO audit | |
|---|---|---|---|
| Question it answers | How is search performing, and why? | Where do we rank for chosen keywords? | What is broken or missing on the site? |
| Covers | Traffic, rankings, CTR, conversions, work done, next steps | Positions for a fixed keyword list | Technical issues, content gaps, links, structure |
| How often | Monthly | Daily or weekly | At the start, then every 6 to 12 months |
| Main data | Search Console, GA4 | A rank tracker | A site crawler plus Search Console |
A rank report is one ingredient of an SEO report. An audit is a one-off diagnosis that feeds the plan. If you pay for “monthly SEO reporting” and get only a list of keyword positions, you are getting a rank report.
What should an SEO report include?
A complete monthly report has these sections, roughly in this order. Put the summary first, because most readers stop reading after it.
- Executive summary. Three to five sentences giving the headline result, the main reason for it and the next priority.
- Organic traffic. Clicks from Search Console and organic sessions from GA4, compared with last month and the same month last year.
- Keyword rankings. Movement for the queries that matter, plus new queries the site started ranking for.
- Click-through rate (CTR). Clicks divided by impressions, for the whole site and for key pages.
- Conversions. Sign-ups, leads or purchases from organic visitors. GA4 now calls these key events.
- Backlinks. New and lost linking sites, if links are part of the plan. This needs a paid tool.
- Technical health. Indexing problems from Search Console, Core Web Vitals, and anything that broke.
- Content performance. Top pages, pages gaining traffic and pages losing it.
- Work completed. What was published, updated or fixed in the period.
- Recommendations. What to do next, in priority order, with a reason for each.
Sections 9 and 10 are the ones most reports skip, and they are the ones readers value most. Numbers without actions leave the reader asking “so what?”
What does an SEO report look like? A sample, number by number
Here is the Search Console section of a monthly report for a small B2B blog. The figures are made up for illustration.
| Metric | This month | Change | What it means | Good or bad? |
|---|---|---|---|---|
| Clicks | 8,420 | +6% | Visits from Google results | Good, if it holds for 2 to 3 months |
| Impressions | 312,000 | +18% | Times a page appeared in results someone saw | Neutral on its own |
| Average CTR | 2.7% | down from 3.0% | Share of impressions that became clicks | Worth a look, see below |
| Average position | 14.2 | from 15.1 | Average top ranking across all impressions | Slightly better, still mostly page two |
| Organic key events | 61 | +4 | Sign-ups from organic visitors | The number that pays for SEO |
What average position 14.2 actually means
Each time your site appears in a search, Search Console records its highest position. It then averages those positions across all impressions (Google explains how position is counted). So 14.2 does not mean a page sits at number 14. It could be a blend of one query at position 3 and dozens of queries at positions 20 to 40.
On its own, a site-wide average position tells you very little, because ranking for more queries usually makes it worse. Say you start appearing at position 45 for 200 new queries. Impressions go up and average position gets worse, even though nothing lost ground.
Read position per query or per page instead. Queries at roughly positions 8 to 20 deserve the most attention, because a small gain moves them onto page one.
Why impressions can rise while clicks fall
This pattern worries people more than any other. Usually it has an ordinary cause:
- New, low rankings. The site started appearing for more queries, mostly low on the page. That brings lots of impressions and few clicks.
- Answers on the results page. An AI Overview or featured snippet answers the question, so fewer people click through.
- Seasonality. Compare with the same month last year, not only with last month.
- A real drop. Your top pages lost positions for their main queries. Check this page by page.
The first two can be fine. The last one needs action. A good report tells you which of the four it is.
Bounce rate is not what it used to be
Older reports list bounce rate as a key metric, but GA4 changed what it means. GA4 counts a session as engaged if it lasts longer than 10 seconds, includes a key event, or has at least two page views. Bounce rate is simply the share of sessions that were not engaged (Google’s definition).
So a reader who spends four minutes on one article no longer counts as a bounce. Report engagement rate instead. Do not compare GA4 bounce rates with figures from the old Universal Analytics, because they measure different things.
AI Overviews and AI visibility in an SEO report
Search results now include AI answers, and reports need to account for them. Two things are worth knowing.
First, Search Console counts clicks and impressions from AI Overviews and AI Mode inside the normal Web search totals (Google’s documentation on AI features). There is no filter that separates them, so you cannot report “AI Overview clicks” from Search Console alone. You can report the likely effect instead. Look for queries where impressions held but CTR fell, then check the live results page to see whether an AI answer now sits above you.
Second, visits from ChatGPT, Perplexity, Gemini, Copilot and other assistants appear in GA4 as referral traffic from their domains. A useful report adds an “AI referrals” line showing sessions, share of total traffic and change.
Treat that figure as a minimum. It only counts people who clicked through. It does not count the times an assistant mentioned you without sending anyone, and some of these visits arrive with no referrer.
Be careful with “AI visibility scores” built by asking assistants a set of sample prompts. The tool chooses the prompts, the answers vary from run to run, and a score is not traffic.
How to create an SEO report in 5 steps
- Set KPIs tied to goals. Start from what the business wants, such as leads, sales or reach in a new market. Then pick two or three KPIs that follow from it, for example organic key events, clicks to product pages and non-branded clicks. Everything else is supporting detail.
- Pick your tools. Search Console and GA4 cover most of a report, and both are free. Add a backlink tool only if links are part of the plan.
- Gather the data, starting on day one. Record a baseline before any work begins, even if results will take months. Without a baseline you cannot show change. Search Console keeps 16 months of performance data, so export what you need before it ages out.
- Analyse instead of listing. For each number that moved, write one line on why. Compare with last month and with the same month last year. Use a regex filter on queries in Search Console to separate branded searches from the rest, because brand searches grow with marketing, not with SEO.
- Recommend next steps. Finish with three to five actions in priority order, each tied to a finding. For example: “Refresh the pricing guide: clicks are down 30% since March.”
Here is what a good executive summary looks like:
Organic clicks rose 6% to 8,420, mostly from the three comparison pages we refreshed in August. Sign-ups from organic search reached 61, up from 57. CTR fell because AI Overviews now appear for two of our top informational queries, so we are rewriting those pages around the questions the overview leaves out. Next month we will fix the two pages missing from Google’s index and publish the integrations guide.
Which tools do you need for an SEO report?
| Tool | Cost | What it adds to the report |
|---|---|---|
| Google Search Console | Free | Clicks, impressions, CTR, position, queries, pages, indexing |
| Google Analytics 4 | Free | Sessions, engagement, key events, AI assistant referrals |
| Looker Studio | Free | Dashboards that combine Search Console and GA4 |
| PageSpeed Insights | Free | Core Web Vitals and speed for individual URLs |
| Semrush or Ahrefs | Paid | Backlinks, keyword volumes, competitor rankings |
The four free tools are enough for most sites. Paid tools add backlink and competitor data that Google does not provide, but their traffic and ranking figures for your site are estimates. When a paid tool and Search Console disagree about your own site, trust Search Console.
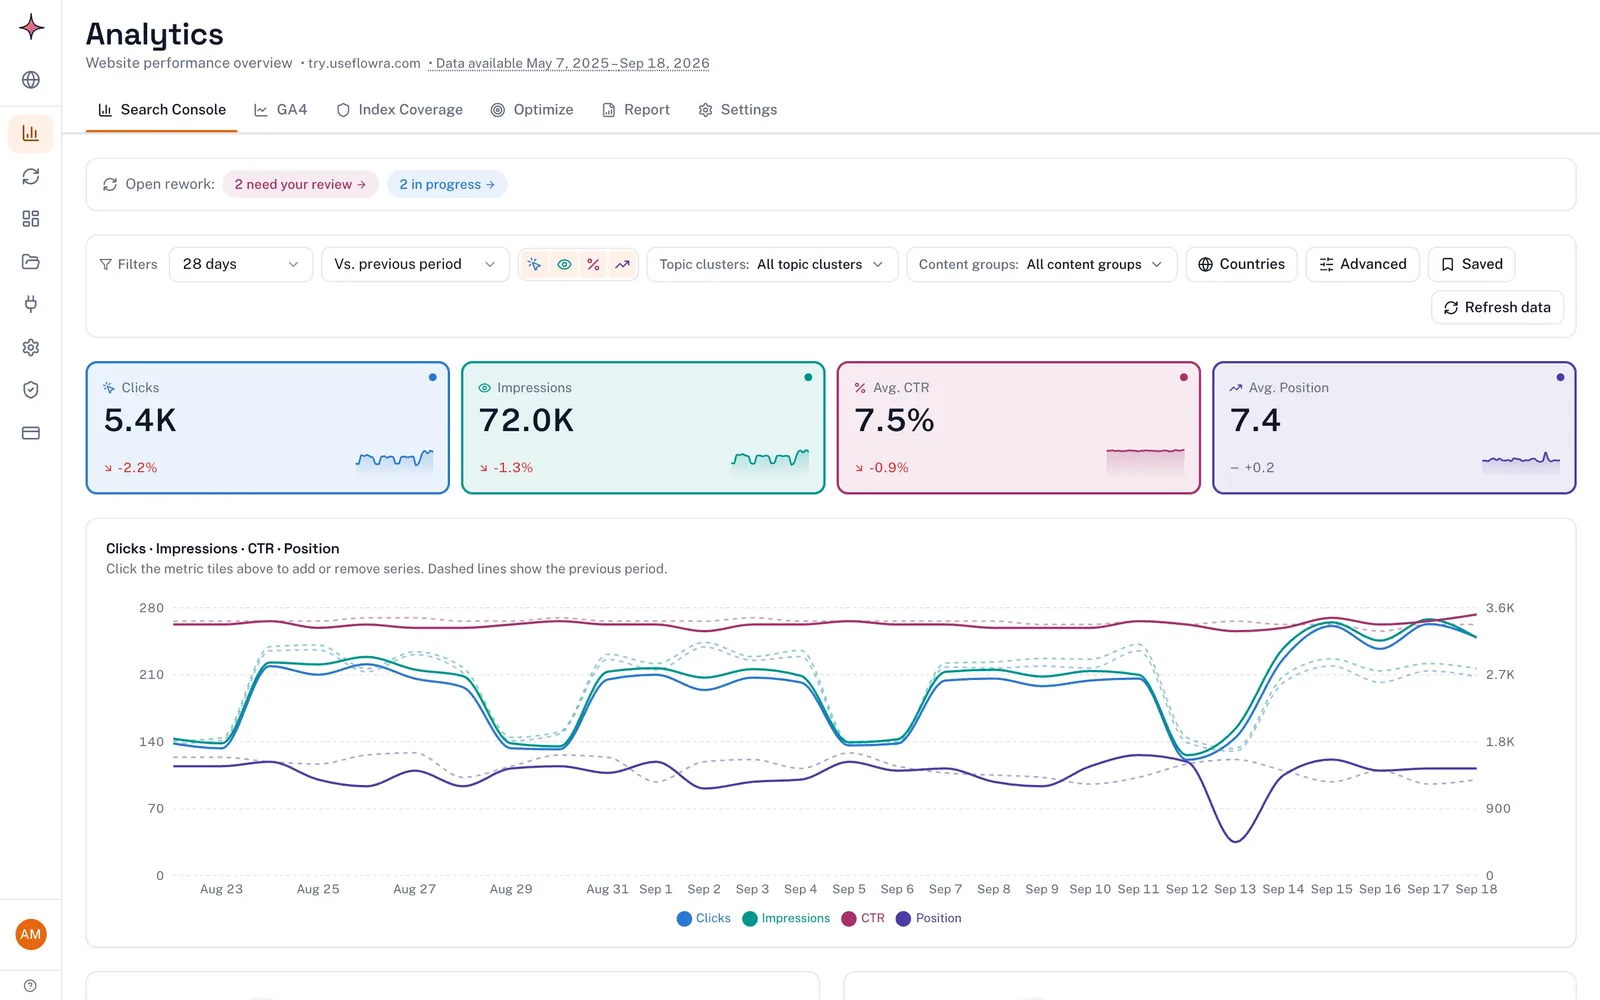
If rebuilding a Looker Studio dashboard every month is the slow part, Flowra (Starter plan and above) puts Search Console and GA4 in one dashboard, with period comparisons and 16 months of history.
How often should you create an SEO report?
Monthly is the default, and it is the right choice for most sites. SEO moves slowly, and a month gives you enough data to see a trend. Search Console data also lags by a couple of days, so a report on just the last week is mostly noise.
- Weekly: a quick check to catch broken pages, indexing drops or a sudden fall in traffic. Use it for monitoring, not for presenting.
- Monthly: the main report for a manager or client.
- Quarterly: a strategy review to ask whether the KPIs and the plan are still right.
Daily ranking changes are not worth worrying about. Positions shift from day to day, and they vary by location and device. Look at 28-day or monthly trends for each query. Act when a page’s main queries fall and stay down for two weeks or more, or when clicks drop sharply across the whole site.
Initial vs ongoing SEO reports
An initial report (also called a baseline report) is made once, at the start. It records where the site stands on traffic, rankings, conversions, indexing and speed, along with any audit findings. Its job is to be the “before” for every later report.
An ongoing report is the monthly one. It compares each period with the baseline and with the previous period, and adds the work completed and the next steps.
Some advice says to wait six months before reporting, because SEO takes time. Waiting before you judge results is sensible. Waiting before you start measuring is not. Write the initial report in week one, then send monthly reports that say plainly what is still too early to call.
Questions to ask whoever sends you the report
If an agency, freelancer or colleague sends you an SEO report, these questions help you tell a real one from a padded one:
- Where does each number come from? Search Console and GA4 figures are measured. Third-party “traffic” figures are estimates.
- How does this month compare with the same month last year? A month-on-month comparison can hide seasonality.
- How much of the growth is branded search? Brand searches rise with ads, PR and word of mouth, not only with SEO.
- Which pages lost traffic, and what is the plan for them? Every site has some. A report with no losing pages is leaving them out.
- What was done this month, and which results came from it?
- Who chose the tracked keywords? A rank report built on easy, low-value keywords will always look good.
- What happens next, and why does that come first?
What to do next
If you write reports, whether for your own team or as SEO reports for clients, open Search Console and go to Performance > Search results. Set the last 28 days against the previous period and write the three-sentence summary before anything else. Then build the rest of the report around what that summary needs. If you have no baseline yet, export your data today.
If you receive reports, send the questions above back with the next one.
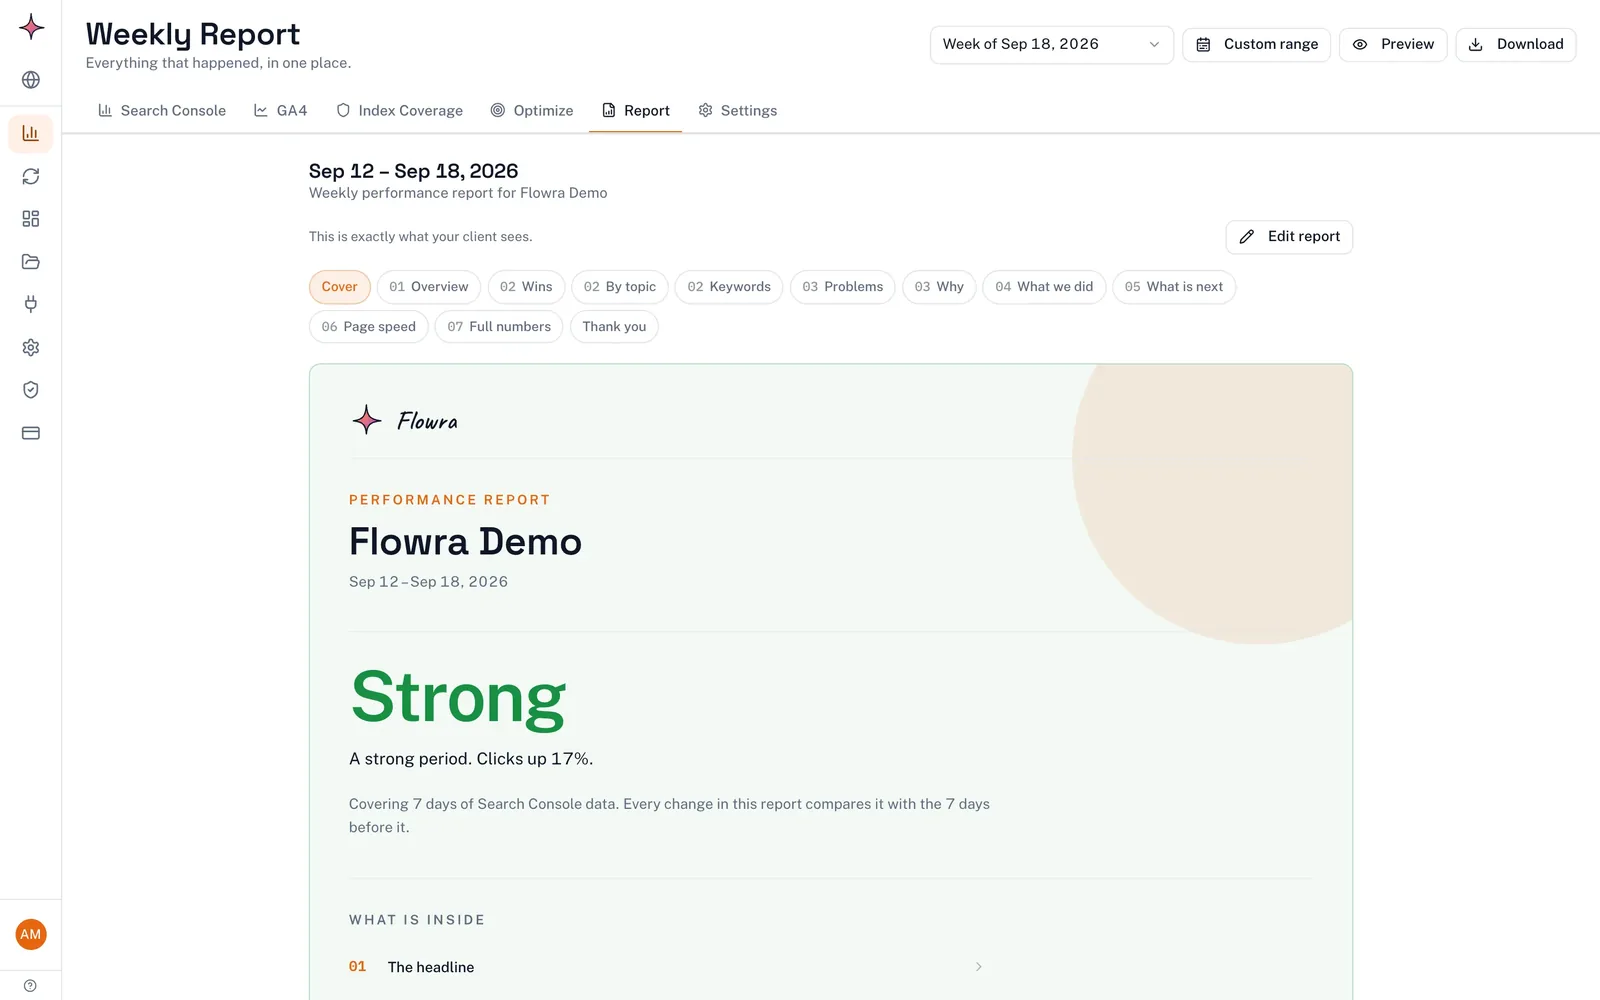
Flowra also builds this report automatically every week for each site, with sections for wins, problems, what was done and what is next. You can share it as a white label SEO report link that always shows the latest week. On Starter and Pro a small Flowra credit stays at the bottom, and the Agency plan removes it.
Frequently asked questions
How do I get an SEO report from Google?
Google does not send a finished SEO report, but Search Console gives you the core data for free. Go to Performance > Search results to see clicks, impressions, CTR and average position by query, page, country and device. Export the data or connect it to Looker Studio to build a dashboard, and add GA4 for engagement and key events from organic visitors.
How can I get a free SEO report?
You can build one from Google Search Console, GA4, Looker Studio and PageSpeed Insights, which are all free and use your real data. Free tools that scan a URL and call the result an “SEO report” usually give you an audit of on-page and technical issues. They cannot see your Search Console data, so they cannot show whether SEO is actually working.
What are the most important metrics in an SEO report?
Organic key events (conversions) come first, because they connect SEO to revenue. Next come non-branded clicks from Search Console, CTR and position for the queries that matter, and the pages gaining or losing traffic. Impressions and site-wide average position are useful context, not goals.
What is the difference between an SEO report and a rank report?
A rank report lists where a site ranks for a chosen set of keywords, often daily or weekly. An SEO report covers traffic, conversions, technical health, work completed and next steps, with rankings as just one section. A rank report tells you positions, while an SEO report tells you whether those positions bring in business.
Should an SEO report include bad results?
Yes. Every site has pages that lose traffic, and hiding them only delays the conversation. A report that shows a drop, explains the cause and gives a fix builds more trust than one where every chart goes up. If the reader finds the bad news in Search Console themselves, the report loses its credibility.